Why Is the Dollar Falling? DXY Drops to 100 as GDP Slows to 1.5%
Quick answer: The Advance Q2 GDP, which came in at 1.5% (vs a forecast of 2.1%), and the Core PCE, which came in at 0.1%...
Quick answer: The Advance Q2 GDP, which came in at 1.5% (vs a forecast of 2.1%), and the Core PCE, which came in at 0.1% (vs 0.2% forecasted), are both examples of weak data and, along with a divided Fed (diminished) interest rate expectations, have contributed to a renewed weakening of the dollar.
The US Dollar Index (DXY) is now at 100.06 on July 30, after a second breakdown in as many days. In the aftermath of soft US data, the DXY has moved from a 15-month high of nearly 101.60 to the psychologically important 100 level.
Why the Dollar Is Dropping: The Data Did the Damage
A negative reaction by the dollar was the case after the Thursday US releases, which were unusually poor:
- Advance Q2 GDP: 1.5% vs. expected 2.1% vs. prior 2.1% — Missed growth target.
- Core PCE Price Index: 0.1% m/m as opposed to the expected 0.2% — indicating the Fed’s preferred inflation measure is declining faster than expected.
- Personal Income: 0.2% (0.3% expected), Personal Spending: 0.3% (0.4% expected) — indicators of a decelerating consumer, both are soft.
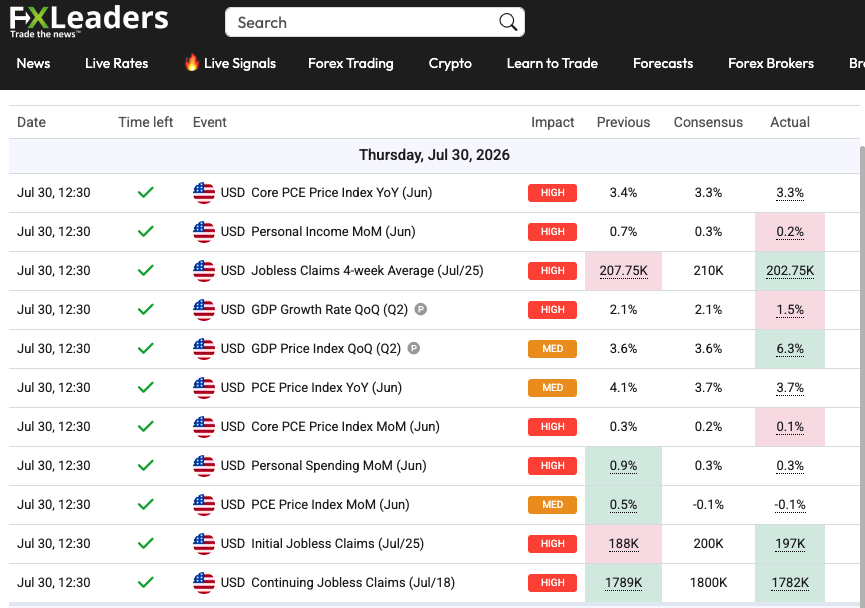
The one hawkish detail was the Advance GDP Price Index at 6.2% (4.1% expected), but the market focused instead on the misses for growth and Core PCE. Decelerating growth coupled with declining core inflation is the exact combination that resurfaces rate cut expectations, and causes the dollar to decline.
The Federal Reserve Set the Tone Preceding the Event
Things began to unravel on Wednesday as the FOMC for the fifth consecutive time settled the interest rate between the 3.50%-3.75% range with a split 9-3 decision and with dissent from 3 members in favor of an increase. Roughly a third of the markets had been set for an increase, so a rate stay was received as a dovish sign. The DXY dropped roughly 0.5% to almost 100.90. The 10-year Treasury eased to around 4.68%. Thursday brought more bad news, and with the FOMC not making an increase and the economy noticeably slowing, concerns grew that not enough members would support a September increase, which the DXY was pricing in since June.
DXY Technical Analysis: At the 100 Line, DXY is Oversold.
The 1-hour DXY chart shows a breakdown with the DXY trading below both its 50- and 200-hour moving average (which were at 101.07 and 101.17) and closing for the day at 100.061. The Relative Strength Index (RSI) was at 17.85 and was extremely oversold. Because of the oversold condition, the probability of a bounce from this level is high, although the trend that has been established is negative.
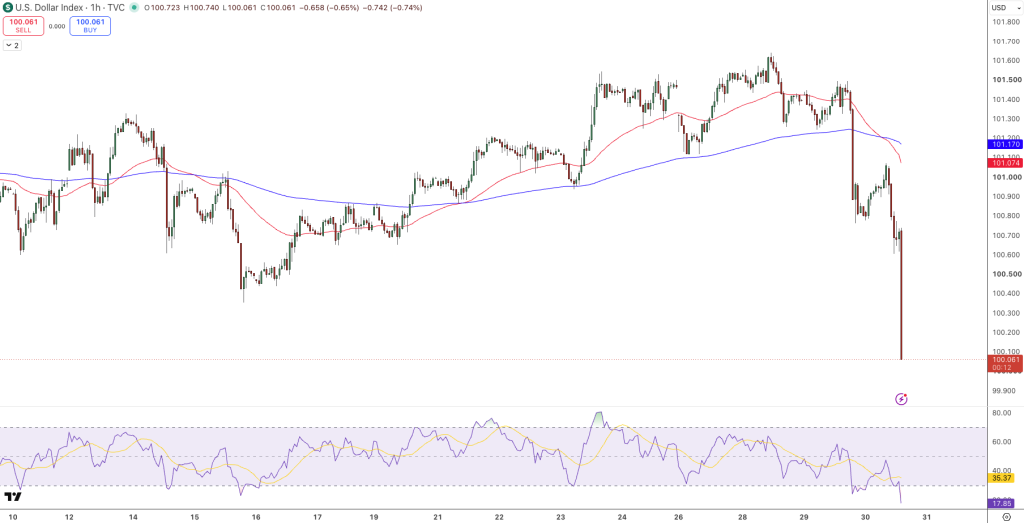
Support is seen at the psychologically significant 100.00, with 99.90 lower. Resistance is seen at 100.70 and at the 101.07 – 101.17 moving average cluster. If the 100.00 level is broken, selling pressure will increase. Because of the currently oversold condition of the RSI, any bounce is likely to stall at 100.70 unless the PCE data on Friday is better than expected.
What is coming for the dollar?
Monthly PCE inflation and personal spending reports will be released Friday along with the Bank of Japan interest rate decision, which will keep USD/JPY volatile. Outside of the data, the offsetting force is the Middle East. Rebounding oil prices with Iran hostilities have offered the dollar a safe-haven bid. Currently, however, the dollar’s exchange rate remains on the soft side of 100, as weak economic growth and cooling inflation outweigh the effects of the Middle East.
- Check out our free forex signals
- Follow the top economic events on FX Leaders economic calendar
- Trade better, discover more Forex Trading Strategies
- Open a FREE Trading Account
- Read our latest reviews on: Avatrade, Exness, HFM and XM

Related Articles
Sidebar rates

Related Posts
 Save
Save