Which levels can define our risk today?
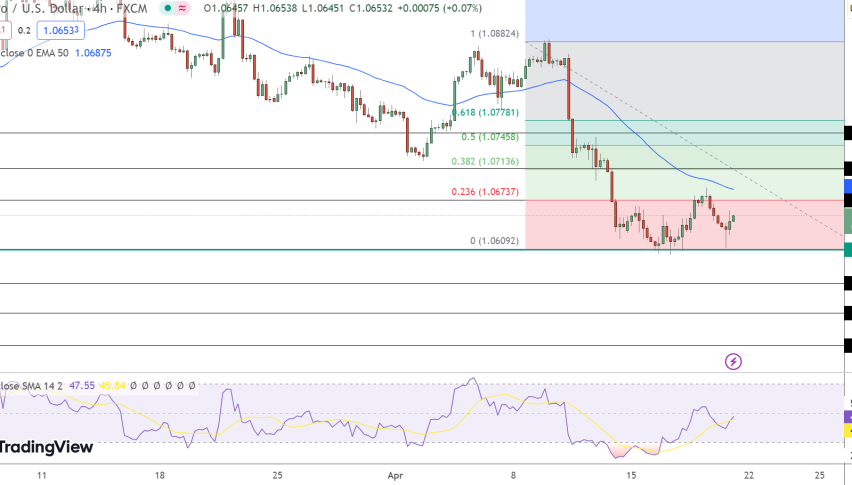
As we said yesterday, buy and sell orders are crowded near the support and resistance levels. So, it´s these levels which define the risk and reward and if we want to buy or sell we should do so around these levels. The resistance levels fo EUR/USD stand at 1.1080 where we can find the 100 smooth moving average, 1.1120 which was yesterday's low and 1.1150. Support comes at 1.10 and 1.09.

Moving averages are very helpful technical indicators in forex
USD/JPY is a bit more complicated since it has moved up 250 pips yesterday. The first resistance level is 104.50 where the 20 moving average on the hourly forex chart awaits, then obviously the 105 round number which topped this forex pair yesterday and the long term support-turned-resistance at 105.50. The 50 moving average on the hourly forex chart will provide the first line of defence at 103.50-60 then 103.00-10 is where the 200 smooth moving average stands strong on the same timeframe forex chart.


