High-Level Event Risks this Week Could Trigger Immense Volatility – NFP’s, OPEC Meeting, and More
The greatest mover among the major currency pairs last week was the USD/JPY with its 230 pip advance. The current risk-on environment does not favor Japanese yen strength at all. The USD/JPY posted a mighty advance of more than 1000 pips in the last three weeks. The election of Donald Trump as the new US president strengthened the US dollar considerably. The S&P 500 which is a good barometer of risk appetite, also rose aggressively. The combination of a very strong US dollar and a healthy appetite for risk has contributed to the impulsive rise in the USD/JPY.
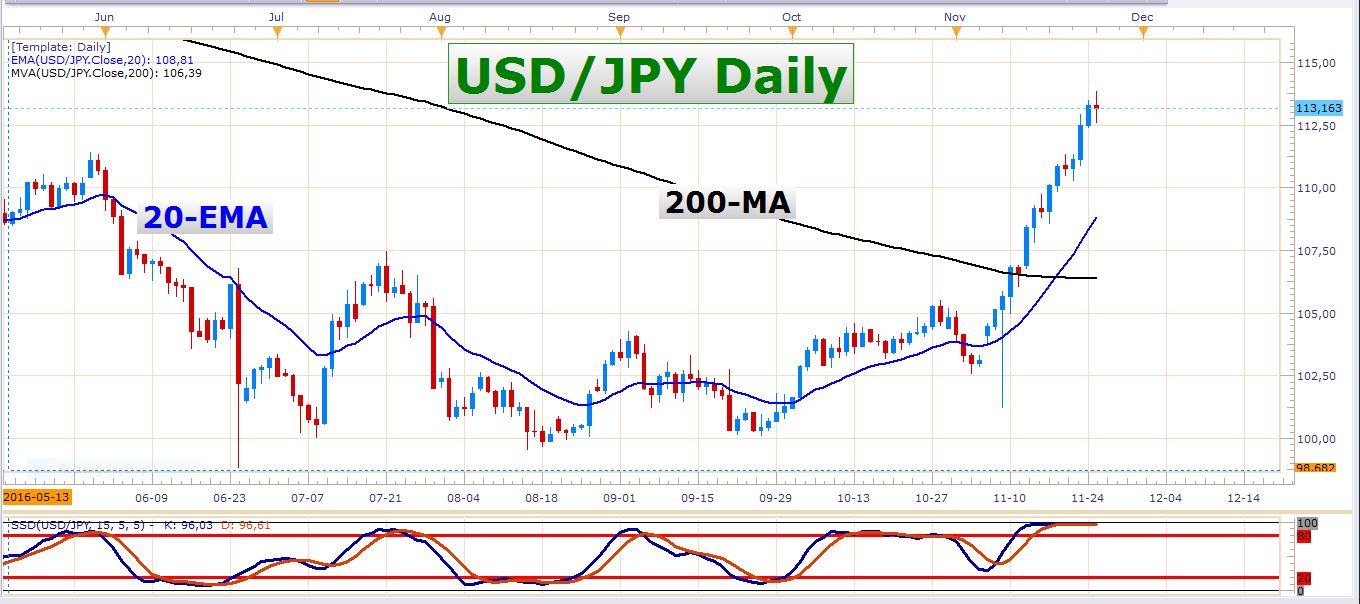 USD/JPY Daily Chart
The move in the USD/JPY is really extended at the moment. Traders who like to trade off daily charts might want to wait a bit before entering long trades on this pair. It would be difficult to attain a good risk to reward ratio at these overbought levels. A pullback to the 20-day exponential moving average would be ideal, although the price could take several days, or even weeks to get there. Of course, it is possible that this pair will keep advancing steadily without retracing soon. If this were the case, it might be ideal to trade this advance on a lower timeframe like an hourly chart.
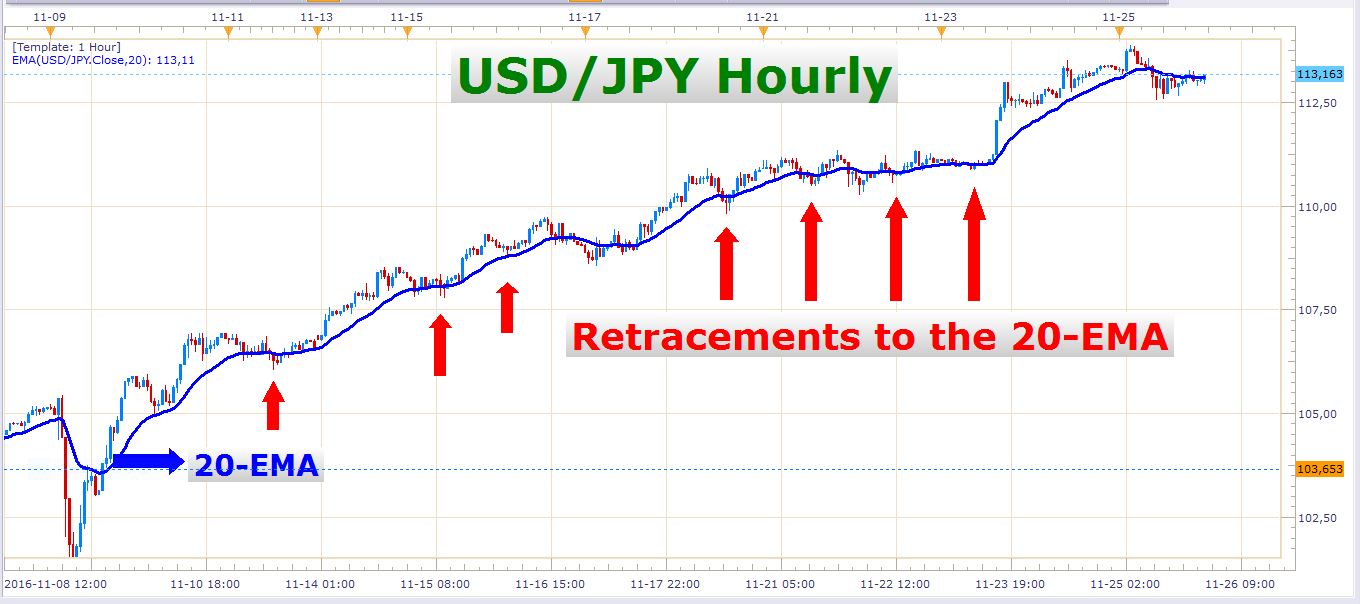 USD/JPY Hourly Chart
In the last sixteen trading days, there have been countless retracements to the 20-EMA which offered great opportunities to ‘buy the dip’. If this pair continues to rise aggressively in the week ahead, there might be some more of these opportunities to seize. However, we shouldn’t exclude the possibility of the pair pulling back in the week ahead. Friday’s daily candle conveys the idea of slight weakness in the uptrend. Look at the following chart:
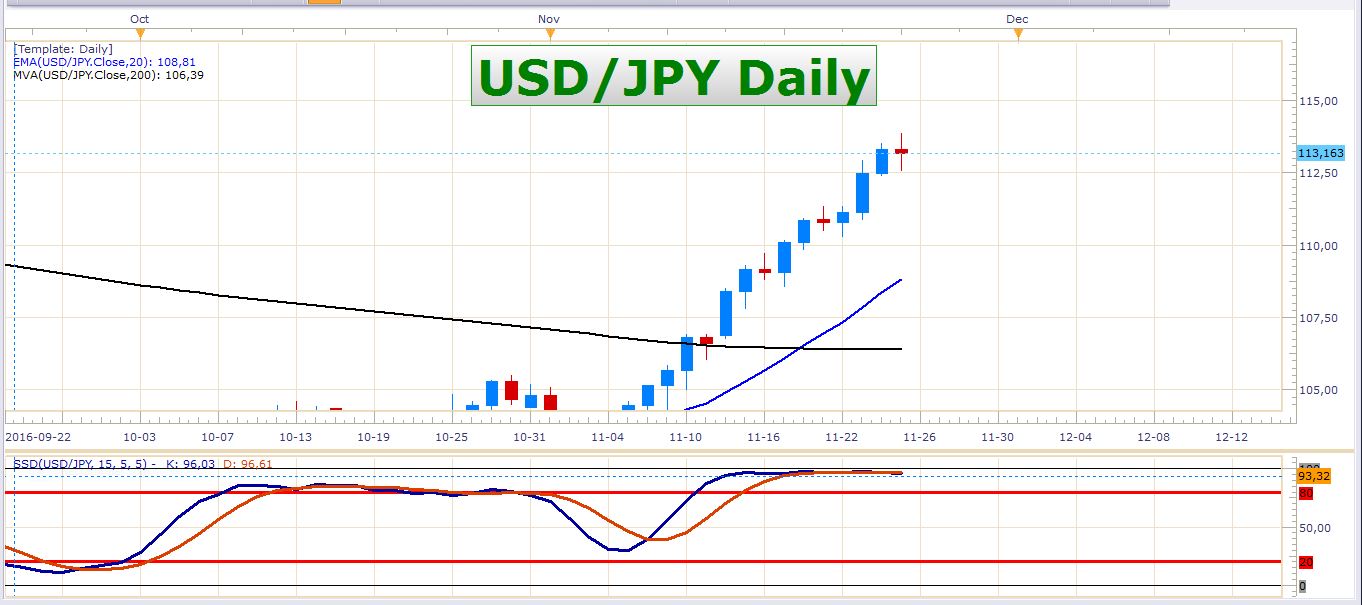 USD/JPY Daily Chart
If you look at the last candle on this chart, you’ll notice that it’s a doji-like candle which means indecision. A doji can often signal that a reversal could be on the way. I don’t expect a trend reversal, but perhaps a retracement of some kind.
If you look at the slow stochastics indicator at the bottom of the chart, you’ll see that it is at an extremely overbought level. Above 80 is considered overbought. Both the K and D lines are currently above 96. This indicator has been in overbought for more than two weeks already. It will be interesting to see how long these lines will remain in oversold territory.
When examining the technical setup on a weekly chart, we can see that the price is fast approaching an important Fibonacci retracement level.
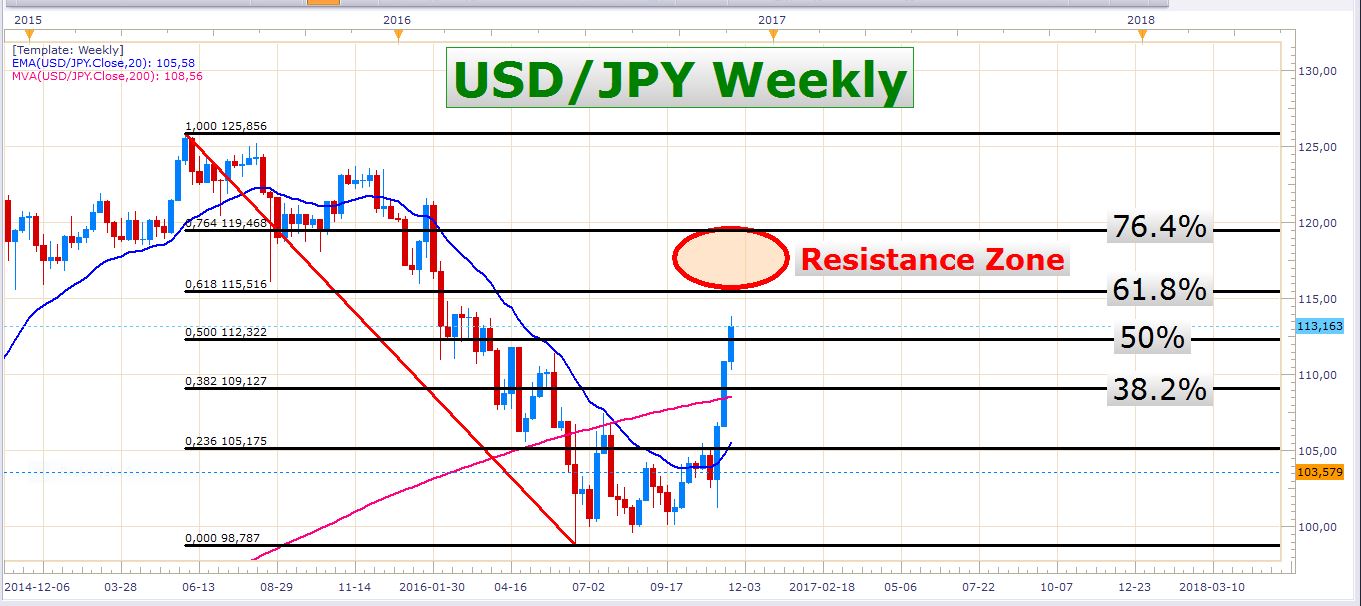 USD/JPY Weekly Chart
The 61.8% retracement of the decline from the May 2015 high to the June 2016 low is the next level of importance. 61.8% retracements tend to be important resistance and support levels, and are widely observed by many traders. The price of a financial instrument often reverses or stalls at the 61.8% retracement, or between the 61.8% and 76.4% levels. Whether these levels will stop the USD/JPY bull-run in this instance is uncertain, but it could easily encounter some resistance there.
The change in the US nonfarm payrolls is a much-anticipated event which often produces massive price movements in the currency market. The market is expecting a rate hike from the FED in December, and all this tension and anticipation may increase the intensity of the NFP’s effect on the FX market. If you’re going to trade this week, you need to keep an eye on these US labor market numbers.
AUD/USD
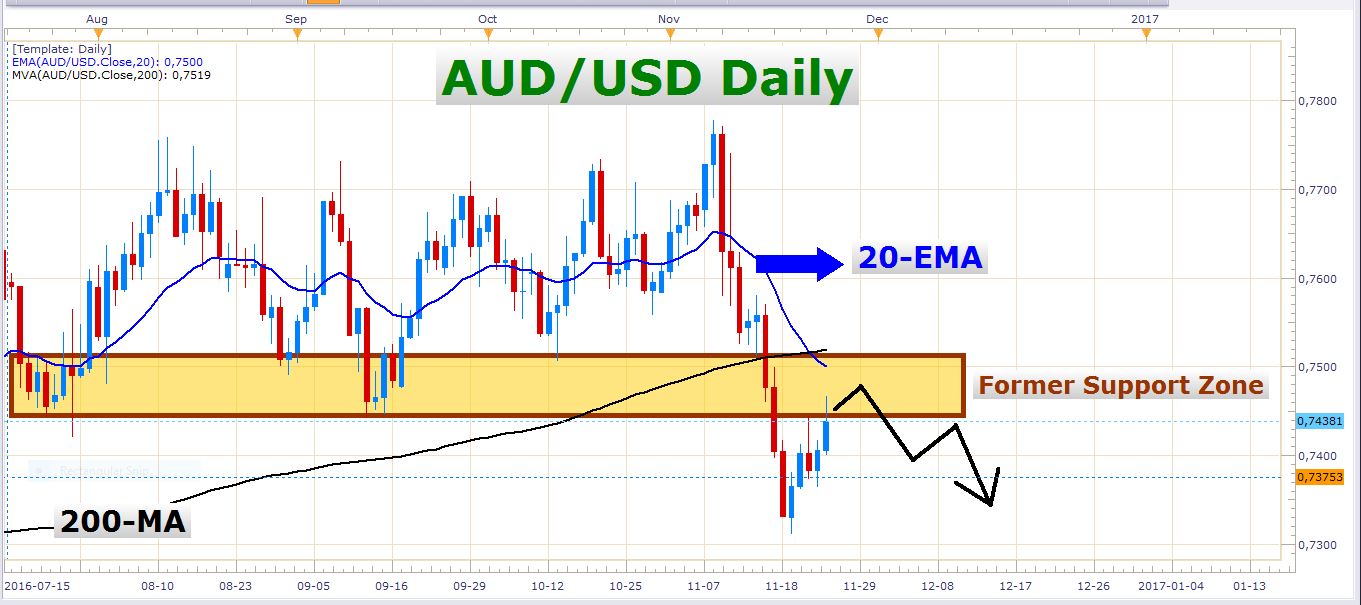
Last week I mentioned a role reversal level on the AUD/USD which could be a good zone to initiate short positions from. The price bounced into this zone on Friday and closed below it. Perhaps we won’t get another opportunity to sell in this zone, but the price could just as well bounce into this zone again in the week ahead. Look at this daily chart:
 AUD/USD Daily Chart
The role reversal level (or zone), is the rectangle marked “Former Support Zone”. This is where an area which formerly acted as support, turns into a zone of resistance.
As you can see on this chart, the 20-day exponential moving average and the 200-day moving average have recently crossed each other, and this cross is right at the role reversal zone’s top. If the price traded up to this point, it could be the perfect level to enter short positions.
USD/CAD
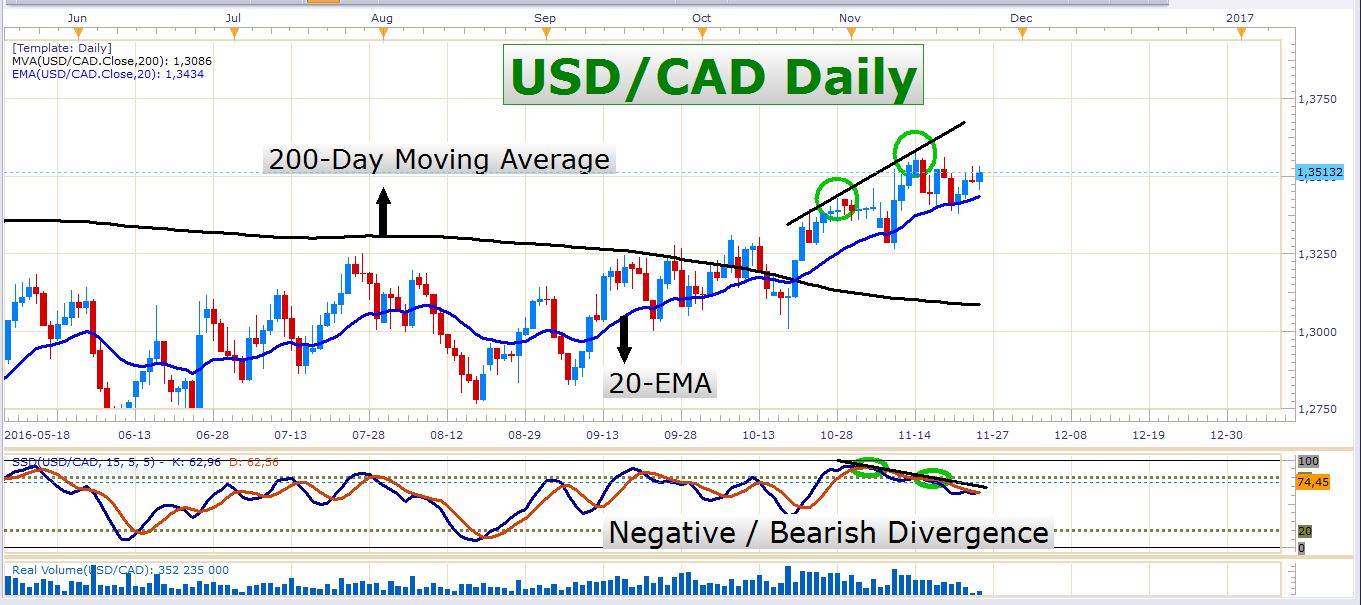
The USD/CAD exchange rate is still supported by the 20-day exponential moving average. Despite the bearish divergence on the slow stochastics indicator, the outlook for the pair remains bullish.
 USD/CAD Daily Chart
As you might know, there is a strong positive correlation between the oil price and the Canadian dollar. This pair and other Canadian dollar pairs could face a lot of volatility this week. The OPEC (Organization of Petroleum Exporting Countries) are trying their best to strike a deal among themselves and other oil exporting countries to cut oil production. OPEC are meeting on Wednesday in Vienna in order to finalize the terms of its first production cut in eight years. Whether they will agree, is uncertain. Iran, Iraq, and Saudi Arabia, OPEC’s three largest producers, remain divided about how to allocate the production cut. Russia, which is not an OPEC member, is unwilling to cut its production output. It is willing to freeze oil production, however.
If OPEC and other oil producing countries manage to overcome their differences and agree to an output cut, the oil price would probably strengthen considerably which would be very positive for the Canadian dollar as well. Conversely, the oil price and the Canadian dollar would suffer from a dissent by the involved parties.
The Canadian GDP numbers will be released at 13:30 GMT on Wednesday. This is important data, so be sure to watch these figures of you’re trading the Canadian dollar. There are also some Canadian employment numbers which will be released on Friday at 13:30 GMT – at the same time as the US NFP’s. These numbers are also very important and capable of moving the Canadian dollar.
USD/CHF
 USD/CHF Daily Chart
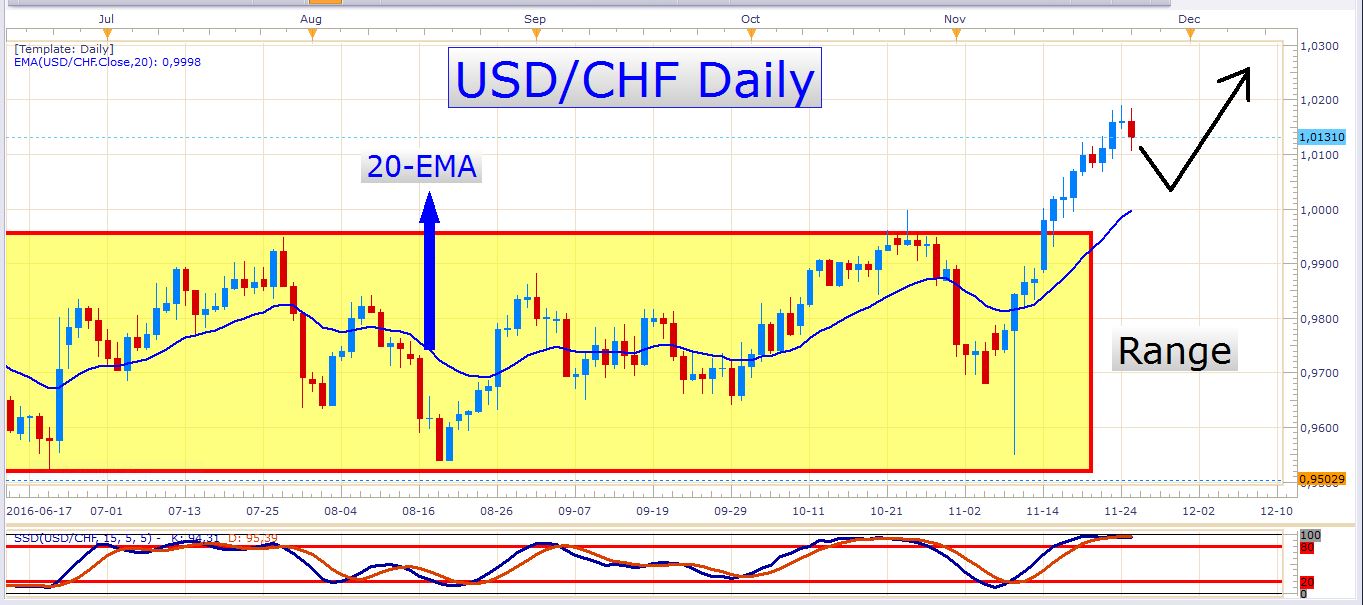
The USD/CHF traded slightly lower on Friday. The pair is still in an overbought condition, however. If the price manages to trade a bit closer to the 20-day exponential moving average, there could be a good opportunity to engage in some long exposure on this pair.
EUR/USD
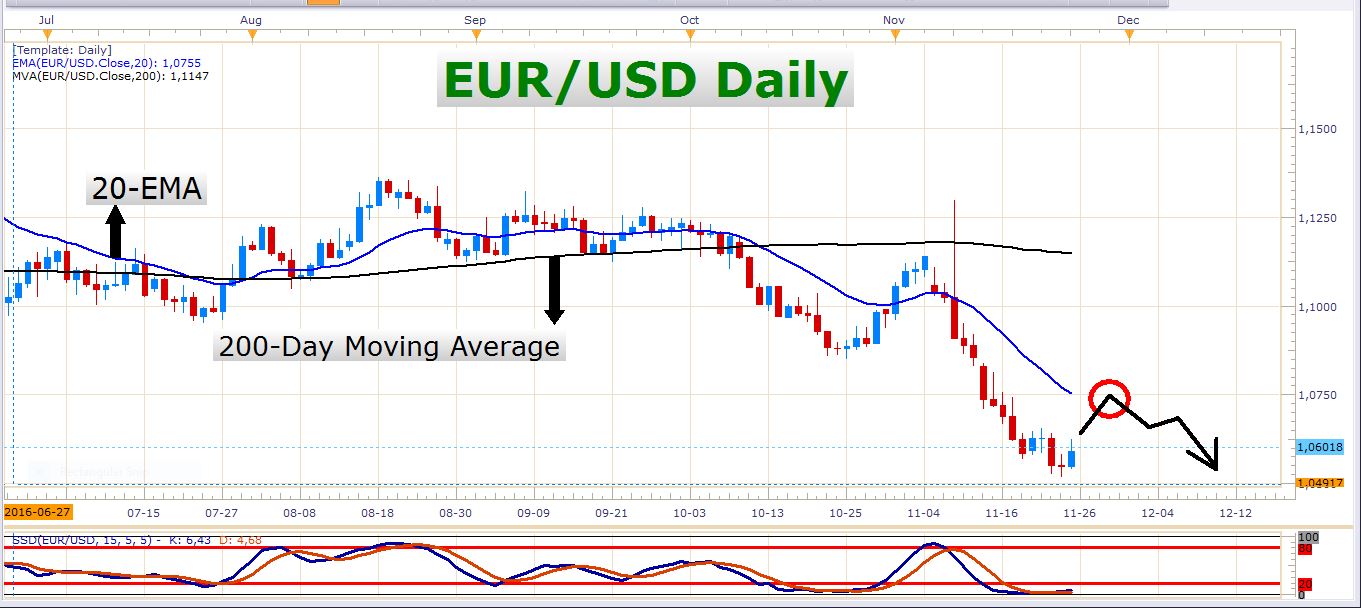
The EUR/USD printed a bullish candle on Friday. Perhaps the pair will manage to retrace some more in the next few days. The outlook for this pair is outright bearish, and patient traders might be able to enter short positions at better levels if we get a retracement into the 1.0750 area.
 EUR/USD Daily Chart
Sometime this week, there’s a UK Joint Ministerial Council Meeting on what the UK’s proposed Brexit negotiations with the other countries will be. There isn’t a fixed day for this, but it should be before the start of the new month. This could affect both the Euro and the British pound.
Monday offers little in terms of important economic data and the FX market will probably be moved mainly by investor sentiment.
Have a splendid trading week!
- Check out our free forex signals
- Follow the top economic events on FX Leaders economic calendar
- Trade better, discover more Forex Trading Strategies
- Open a FREE Trading Account
- Read our latest reviews on: Avatrade, Exness, HFM and XM
Related Articles
Sidebar rates
Related Posts
