USD/CAD Powers Higher on a Slow Day in the Markets
As I’m starting to write this article, the USD/CAD is pressing new daily highs, and just about 7 pips away from one of my take profit orders. I was expecting a very quiet day in the currency market, which it was. Luckily there were one or two exceptions, of which the USD/CAD is one. While the other major pairs barely moved today, the USD/CAD gained about 68 pips so far. Really impressive for this time of the year! Look at this daily chart:
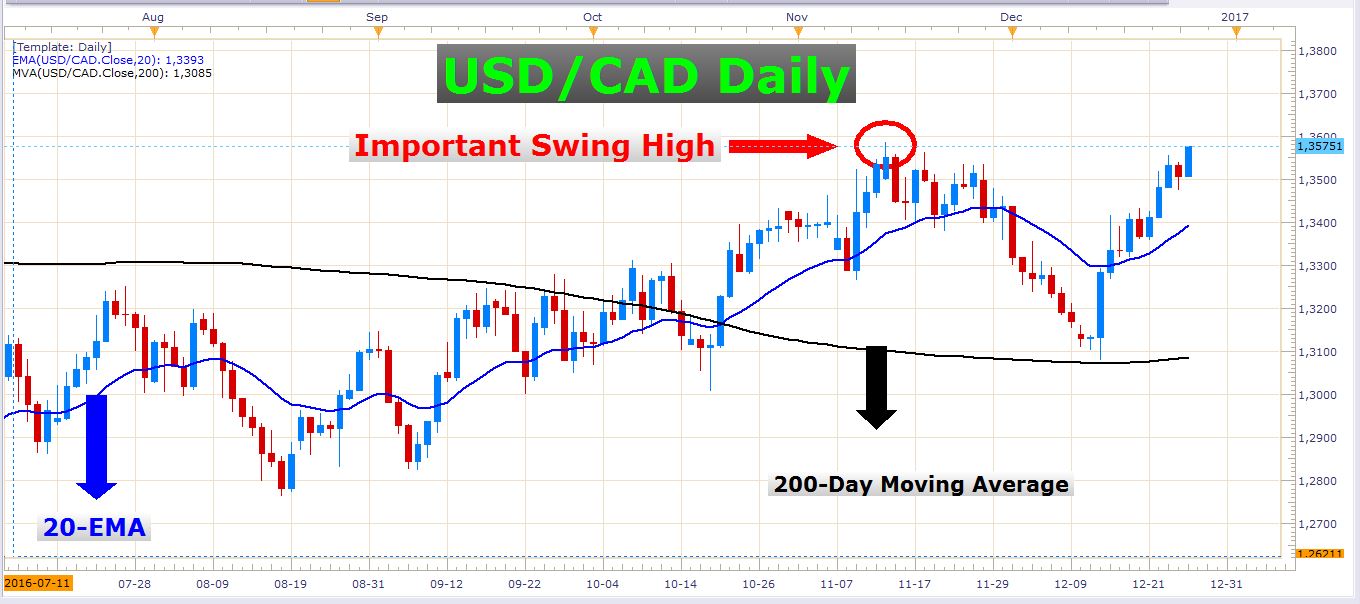 USD/CAD Daily Chart
Not only did today’s price action take out the previous two daily bars’ highs, but a very important swing high is currently coming under fire. The exchange rate needs a mere 12 pips to break this important level which is marked with a red circle on the chart above.
You might be wondering why this level is so important. You see, there are probably a lot of stop loss orders stacked just above this swing high. That is, stop losses of traders who went short. Many short traders might have closed out their positions already, but some are still holding on to these sell positions, hoping for a price reversal to drive down the price again. So if the price breaches this important level (1.35885), many traders will be forced to perform buy transactions as their stop loss orders get triggered, adding extra fuel to a fiery bull trend which is already blazing with buyers. Although the follow-through of such a break could be limited at this time of the year, there could certainly be some aggressive follow through in the new year when market participation will be denser. Before we look at a trade setup, let’s examine a weekly chart of this pair:
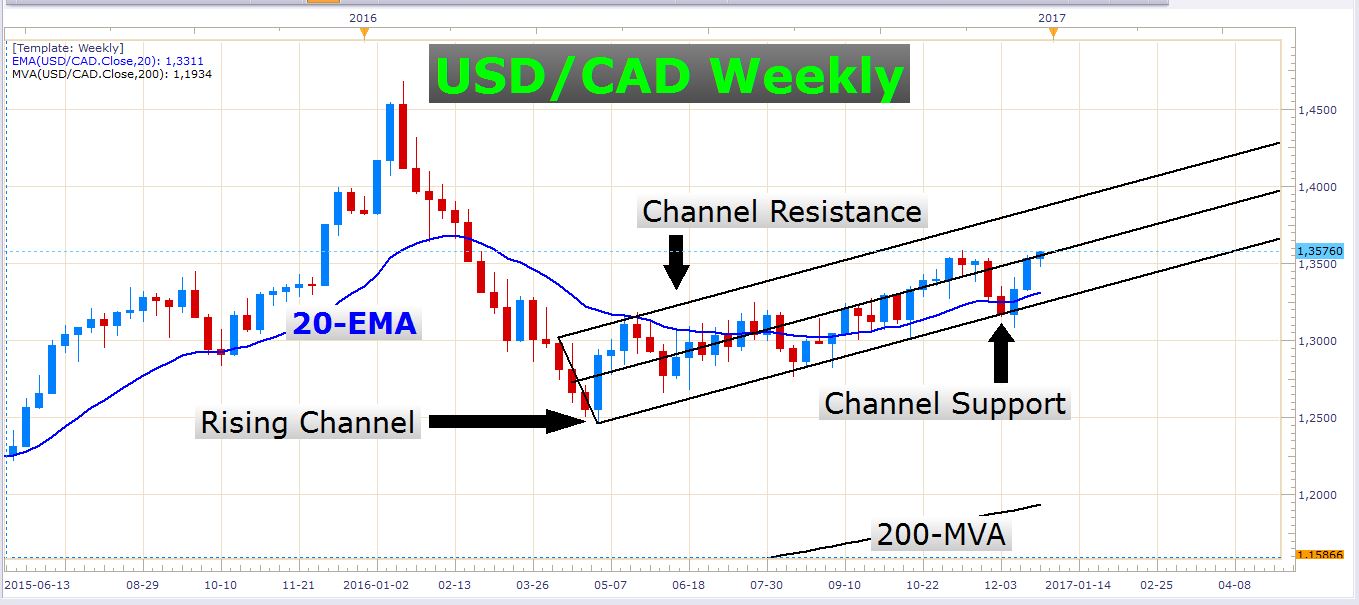 USD/CAD Weekly Chart
It is evident that the bullish market players are controlling the market. One of my teachers once taught me not to fight the institutional participants which are the ones who move and control the currency market. These are the guys throwing around millions and billions of dollars all over the scene as if it were small change. New traders often trade against major momentum which is something that drains their accounts quickly. Picking tops and bottoms in strong trends is very dangerous. Trading with the trend is where the big money lies, and that is exactly what I’m talking about in this instance. For many weeks the USD/CAD has been printing higher highs and higher lows – the vital characteristics of a healthy uptrend. At this very moment, the pair is about 12 pips away from breaching another important swing high on the weekly (and daily) chart. The chances of reaping some more upside from this pair are good, so let’s look at how we can play it…
I bet you’re expecting a mighty technical trade setup. Well, simplicity often makes more money than complexity. Here is the daily chart again:
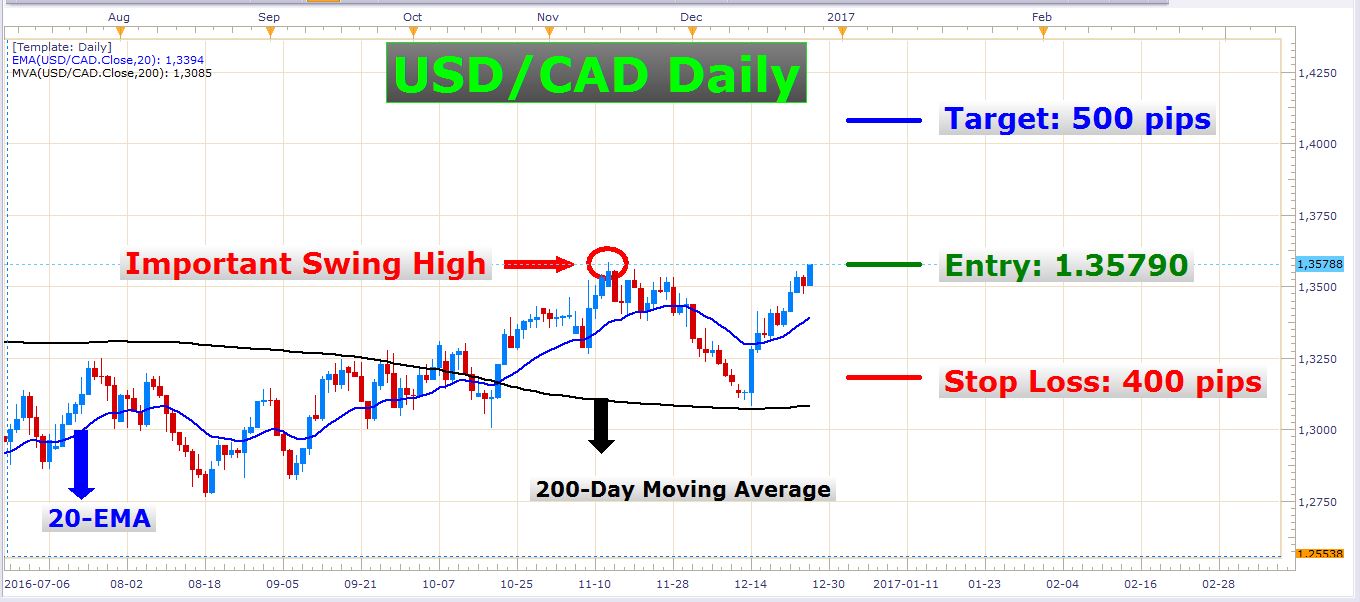 USD/CAD Daily Chart
This is a trade setup which could take a few weeks to play out. If you don’t have enough patience to wait so long, this might not be your ideal trade. This is probably the simplest trade setup you could use on this pair at the moment. I agree, there might be finer entries and better opportunities in the days to come, and perhaps I will go over these in the next few weeks, but here we have a simple setup which could add an extra one or two percent to your account over the next few weeks or even in a few days if you’re lucky. You needn’t watch it all the time, perhaps once every two days. You can move the stop loss to break-even when the trade is in profit by about 350 pips. If you’d like to set and forget it, this can also work. I’ve just placed a buy stop order at 1.35790 risking one percent of my account and targeting 1.25 percent. Stop loss = 400 pips, and take profit = 500 pips. Let’s see how it goes, I’ll keep you guys updated. Remember, this trade could take weeks to reach its target or stop loss. Also remember not to risk money you can’t afford to lose. FX trading is risky, and this trade (like any other trade) could easily go in the wrong direction. We are trading probabilities, not certainties. Okay, that’s enough disclaimer talk, for now, let’s quickly look at the USD/JPY:
USD/JPY – 2nd Most Traded Currency Pair in the World
Only the EUR/USD boasts more liquidity than the USD/JPY. Deeper liquidity often adds to more consistency when it comes to technical analysis in FX trading. Moves are often less choppy, and stop loss placement can normally be more exact than with exotic FX pairs or commodities, for example.
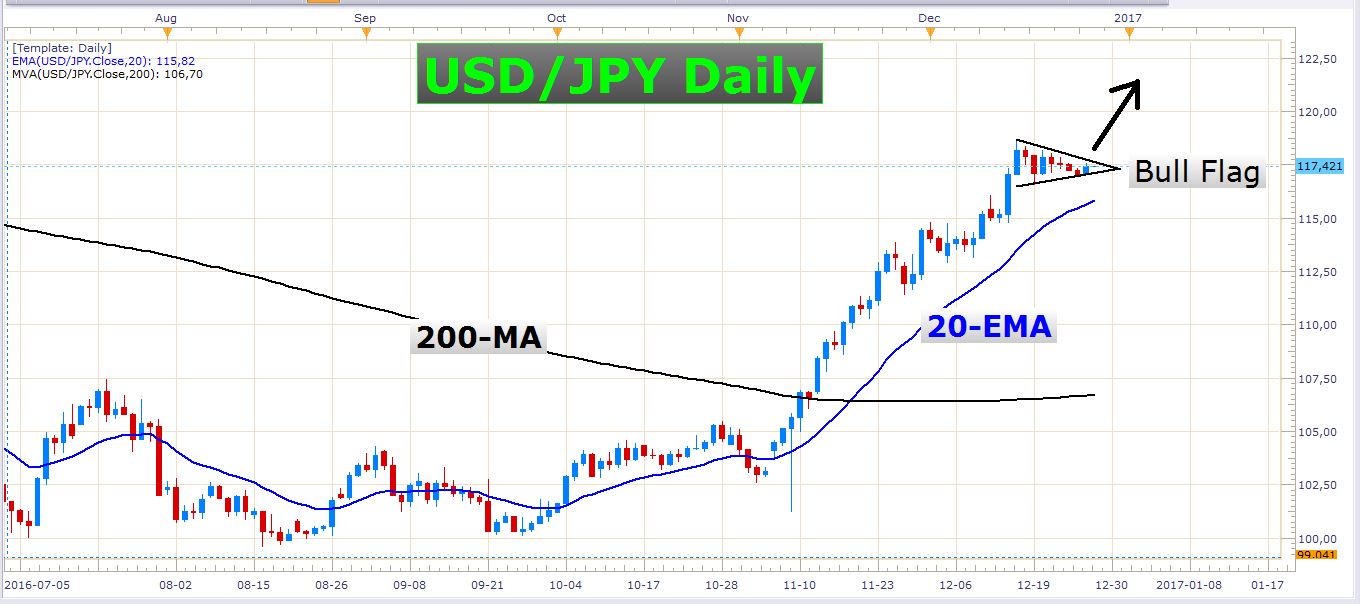 USD/JPY Daily Chart
The USD/JPY has consolidated in the last couple of days. This consolidation is in the form of a bull flag, which is a continuation pattern. At the moment it looks like this mighty rise in this exchange rate is not over yet. If the pair pushes to fresh daily highs soon, it could open up the way to 121.60, and after that 123.70, followed by 125.00.
That’s all for today, fellow traders. Enjoy the last few trading days of 2016!
- Check out our free forex signals
- Follow the top economic events on FX Leaders economic calendar
- Trade better, discover more Forex Trading Strategies
- Open a FREE Trading Account
- Read our latest reviews on: Avatrade, Exness, HFM and XM
Related Articles


Sidebar rates
Related Posts
