Bearish WTI Crude Oil Finds Support – Ready To Buy?
In the Asians and European trading sessions, the Crude oil prices have been restricted to the somewhat tighter trading range since the Organization of Petroleum Exporting Countries (OPEC) failed to halt the bearish momentum in the oil prices.
Today we are encountering another bearish wave which appeared in response to the rising output from Libya. The latest update added to concerns about rising U.S. production that is threatening OPEC output cut decision in order to support the falling oil prices.
According to National Oil Corporation of Libya, their oil production is presumed to expand to 800K barrels per day (BPD) which is weighing on the crude oil prices.
Forex Trading Signal
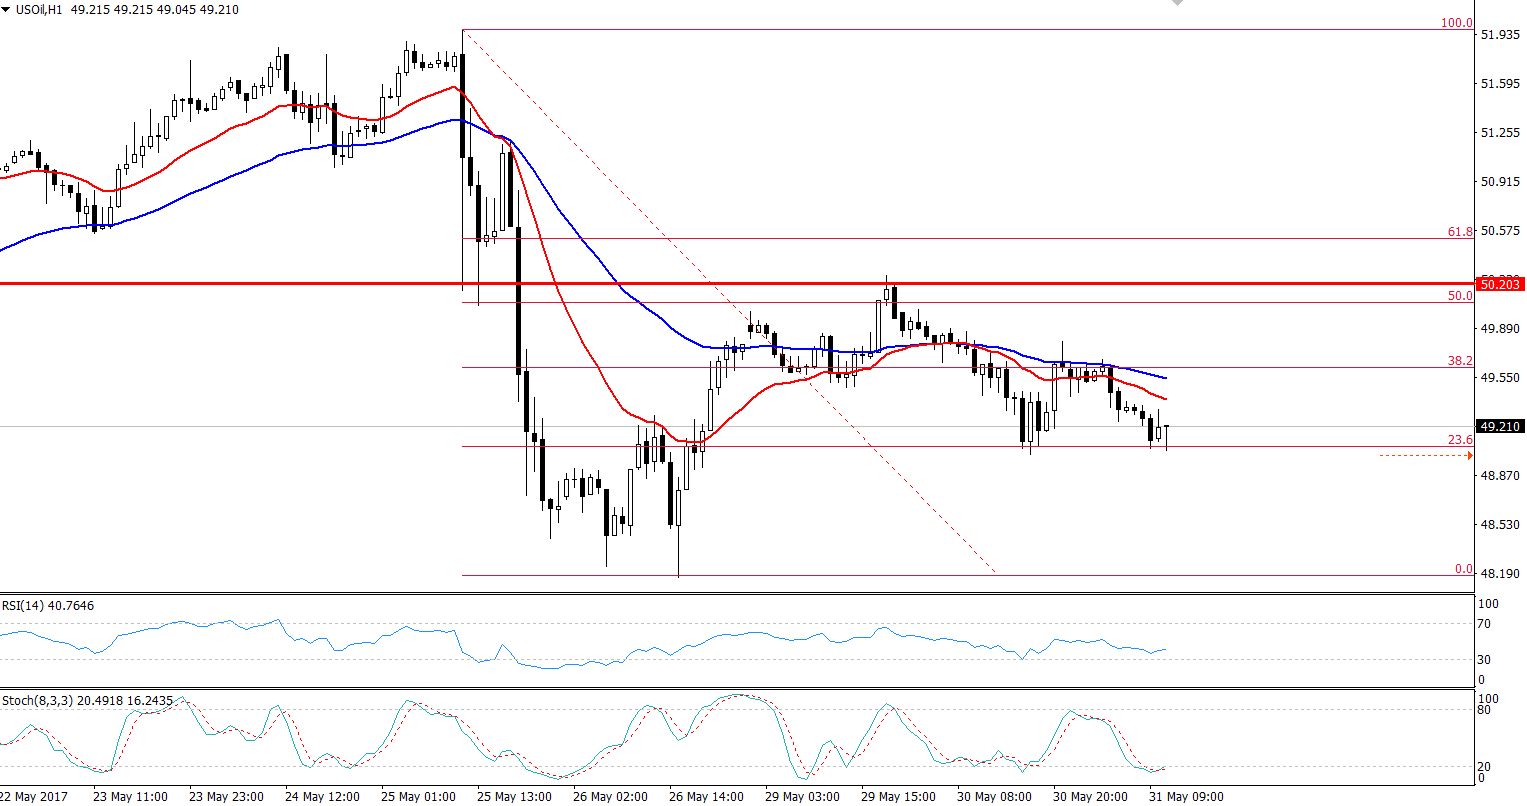
At the moment, I'm looking to add a buying position somewhere around $48.30, with a stop loss of $48 and a take profit of $48.80

Technical Outlook – Intraday
On the hourly chart, the WTI crude oil has broken below the descending triangle pattern which previously was supporting to oil at $49. At the moment, the black gold has dived below the support level of $49 to test the triple bottom support level of $48.30.
Anyways, one of the good things about this scenario is that the market has entered the oversold trading zone, and our buying position will get benefit out of it.


