This Moving Average on the Daily Litecoin Chart Is Saving Our …
A couple of weeks ago we issued a buy forex signal in Litecoin alongside my Litecoin trade that I simultaneously opened with my broker. Cr
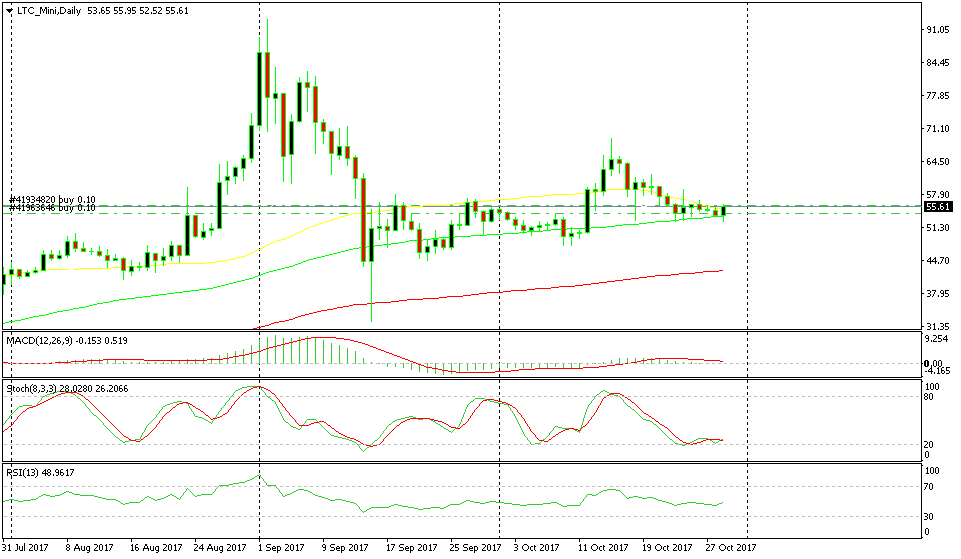
A couple of weeks ago we issued a buy forex signal in Litecoin alongside my Litecoin trade that I simultaneously opened with my broker. Cryptocurrencies were retracing lower during the previous few days after a decent run higher, so we thought that the retrace was over.
We were looking at the 50 SMA (yellow) as a possible support indicator. The long wick candlestick was another bullish signal which pointed to an upward reversal.
But the retrace lower wasn’t over and the reversal didn’t happen. So, we held on to our Litecoin signal as the price slipped lower.
In the next few days, the price reached the 100 SMA on the daily Litecoin chart as the entire cryptocurrency market continued to pullback. We were getting worried, but the 100 SMA (green) came to our rescue.
 Stochastic is starting to turn up after touching the oversold area
In fact, this moving average has saved our skin in the last week. Sellers kept selling but the price couldn’t break below the 100 SMA, which kept the sellers in check. There was a quick spike below the 100 SMA today, but the price climbed back just as quick. This means that the buyers aren’t going to let the price break the 100 SMA.
The daily candlestick looks bullish if it is to close as it is. It would be even more bullish if it closes above the 50 SMA which has acted as resistance in the last eight days. Well, the price just jumped above the 50 SMA while I was writing this update on cryptocurrencies so it all looks right now.
- Check out our free forex signals
- Follow the top economic events on FX Leaders economic calendar
- Trade better, discover more Forex Trading Strategies
- Open a FREE Trading Account
- Read our latest reviews on: Avatrade, Exness, HFM and XM
Related Articles


Sidebar rates
Related Posts
