EUR/USD Trades Between Two Moving Averages
This week, the EUR/USD has been slipping lower, and the price has fallen below the 20 (grey) and 50 (yellow) SMAs on the H4 chart.
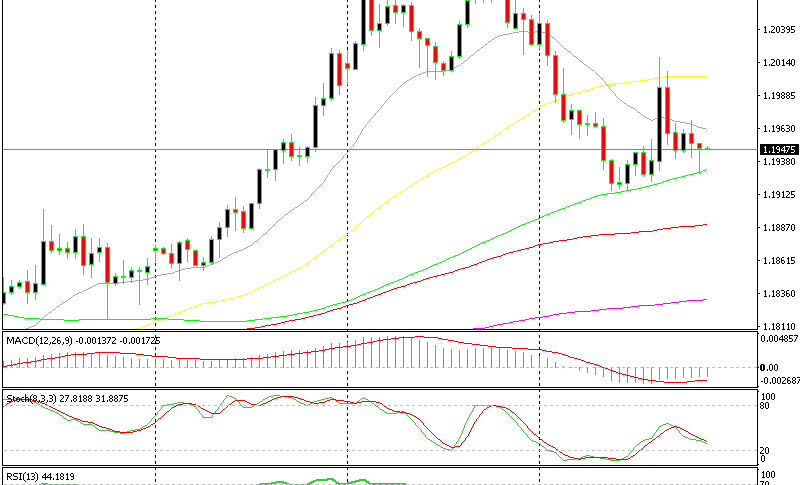
This week, the EUR/USD has been slipping lower, and the price has fallen below the 20 (grey) and 50 (yellow) SMAs on the H4 chart for the first time in a month. We saw a whopping 100 pip jump in this pair yesterday, when Chinese officials announced they may stop buying US bonds, which came as yet another surprise along with the impressive Australian retail sales, and the rumors about the US pulling out of NAFTA.
That being said, along with the EUR/USD, several forex pairs jumped 80-100 pips higher yesterday.
The range is defined by the 100 SMA on top and the 50 SMA at the bottom
The EUR/USD jumped above the 1.20 level, but didn’t remain there for long. It reversed back down soon after, and this morning we are already nearly 100 pips lower from the top. The 50 SMA was standing at 1.20, which adds extra strength to this big level.
As you can see on the chart shown above, the 50 SMA (red) is providing resistance while the 100 SMA (green) is providing a solid support.
This pair is now trading between these two moving averages; the 50 SMA on top, and the 100 SMA at the bottom. Which moving average is going to go first?
According to this chart, the lower moving average seems to be more at risk. The sellers jumped in pretty quickly above 1.20, so it looks like this pair is standing strong up there. From the other side, the 100 SMA is also holding on quite strong at the bottom. For the moment it’s a close call, but the risk of the lower moving average seems heavier.
- Check out our free forex signals
- Follow the top economic events on FX Leaders economic calendar
- Trade better, discover more Forex Trading Strategies
- Open a FREE Trading Account
- Read our latest reviews on: Avatrade, Exness, HFM and XM
Related Articles


Sidebar rates
Related Posts
