New Forex Signal in GBP/USD. Making Use of Moving Averages Again
GBP/USD has been trying to break above the round level at 1.39 all day today. But, the 200 SMA on the H1 chart has held up pretty well.
GBP/USD has been trying to break above the round level at 1.39 all day today. But, the 200 SMA on the H1 chart has held up pretty well and it has reversed the price down quite a few times and we decided to open a sell forex signal just below it.
If you switch to the H4 chart, you can find the 100 SMA at 1.3920. So, that moving average remains as a defence for us if the buyers decide to push above 1.39.
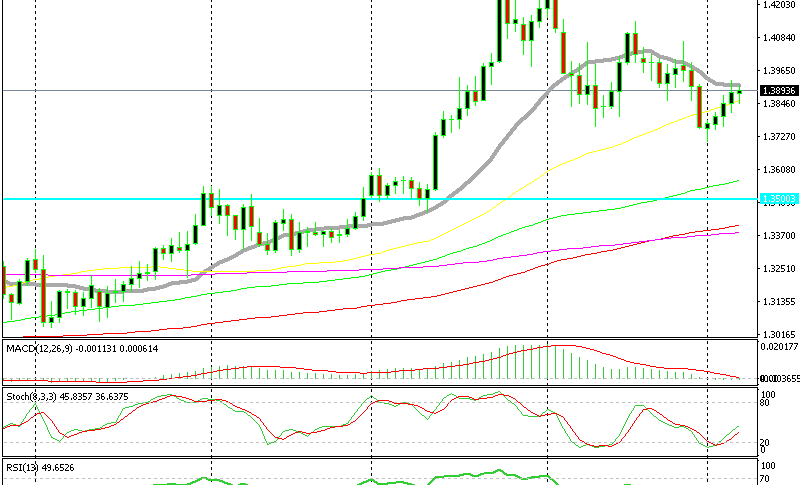
But, it’s the daily chart that persuaded us to open that forex signal. As you can see from the daily GBP/USD chart below, the trend has changed in February and the 20 SMA (grey) has been providing resistance all month.
The 20 SMA has been the ultimate resistance in February
The buyers managed to push above it once in the middle of the month, but the sellers pushed this pair back down again. So, this moving average has been solid resistance since early February.
Right now, it comes at 1.3912. The stochastic indicator is headed up on this timeframe chart, but the H4 and H1 charts are oversold. So, the retrace up seems complete. Hopefully, the sellers will take control soon now.
- Check out our free forex signals
- Follow the top economic events on FX Leaders economic calendar
- Trade better, discover more Forex Trading Strategies
- Open a FREE Trading Account
- Read our latest reviews on: Avatrade, Exness, HFM and XM
Related Articles


Sidebar rates
Related Posts
