Gold Completes 61.8% Retracement, What’s Next?
The risk-off sentiment seems to be fading after news that the US and China are set to commence trade negotiations. Gold is on hold today...
The risk-off sentiment seems to be fading after news that the US and China are set to commence trade negotiations. Gold is on hold today as most traders are away owing to the Easter holiday and will be saving their shots for US NFP figures later this week.
Key Technical Drivers
I was analysing the Gold chart for technical patterns and figured out a bullish Gartley pattern on the daily chart. Gold is forming a bullish Gartley pattern linking X ($1240) to A ($1357). Gold is on its way to complete a 61.8% Fibonacci retracement at $1326.
After a slight retracement, Gold is likely to continue the C to D wave.
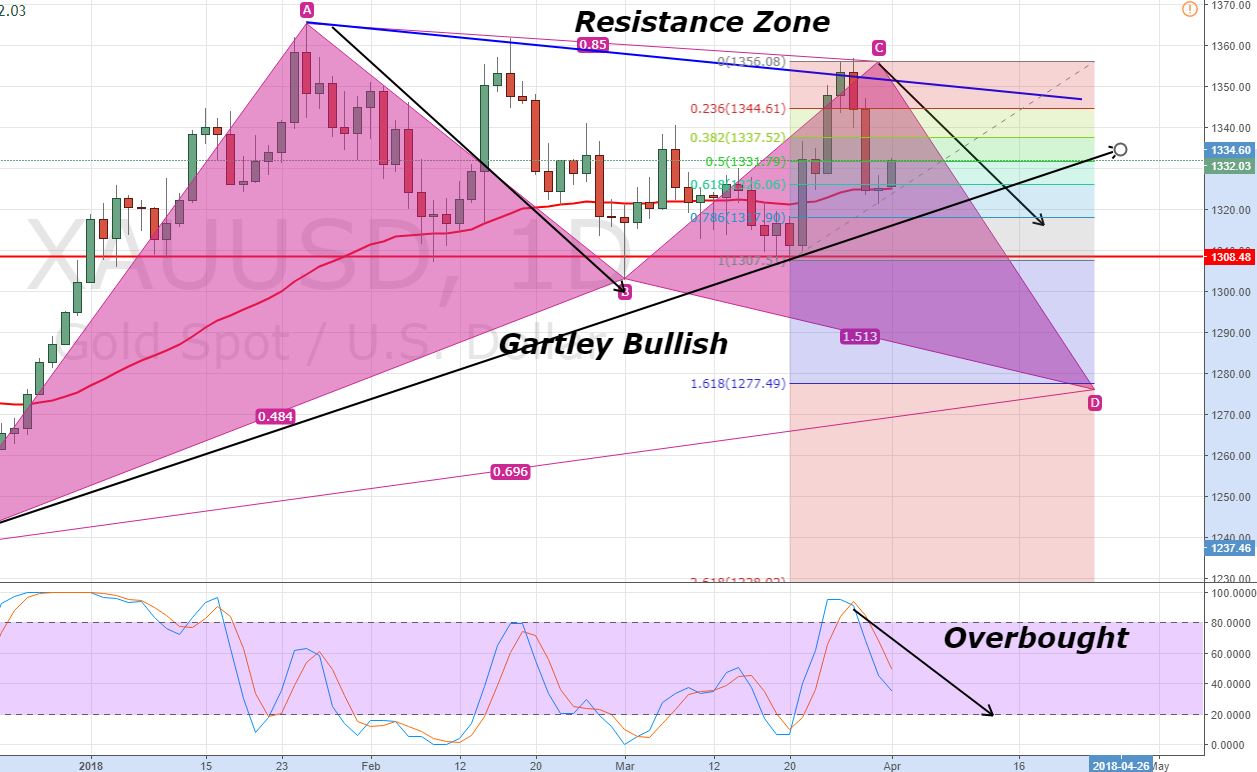
Gold – Daily Chart
The yellow metal has the potential to go for point D at $1,270. The bullish trendline is supporting the yellow metal exactly at the same level of $1326. The Stochastic & RSI are below 50 signaling a potential bearish move.
Gold – Trading Idea
The idea is to stay bullish above $1326 with a stop below $1322 and take profits at $1333, $1337 and $1339. Good luck fellows; I wish you another profitable day.
- Check out our free forex signals
- Follow the top economic events on FX Leaders economic calendar
- Trade better, discover more Forex Trading Strategies
- Open a FREE Trading Account
- Read our latest reviews on: Avatrade, Exness, HFM and XM
Related Articles


Sidebar rates
Related Posts
