Crude Oil Testing $73 – Is It Good Time to Short?
In this update, we are going to see what exactly caused a heavy buying in crude oil and what should we expect from the oil today and...

In our previous update on crude oil, we discussed the outcome of API report and tried to forecast the EIA decision. The market mostly traded in line with our forecast to hit our target at $71.40. In this update, we are going to see what exactly caused a heavy buying in crude oil and what should we expect from oil today and tomorrow. Check this out…
EIA Weekly Crude Oil Stock – Quick Review
As per the Energy Department, the U.S. crude inventories fell 9.9 million barrels versus forecasts for a 2.4 million-barrel. Typically, the draw in inventories hikes the prices of crude oil and that’s what happened yesterday. At 416.6 million barrels, the U.S. crude oil inventories are about 4% beneath the 5-year average for this time of the year.
WTI Crude Oil – Technical View
On the daily chart, crude oil is trading right below a double top resistance level of $73. Back on April 22, the same level halted the bullish trend in crude oil as the markets were overbought. Currently, we are facing almost the same scenario. Can we expect a pullback in oil?
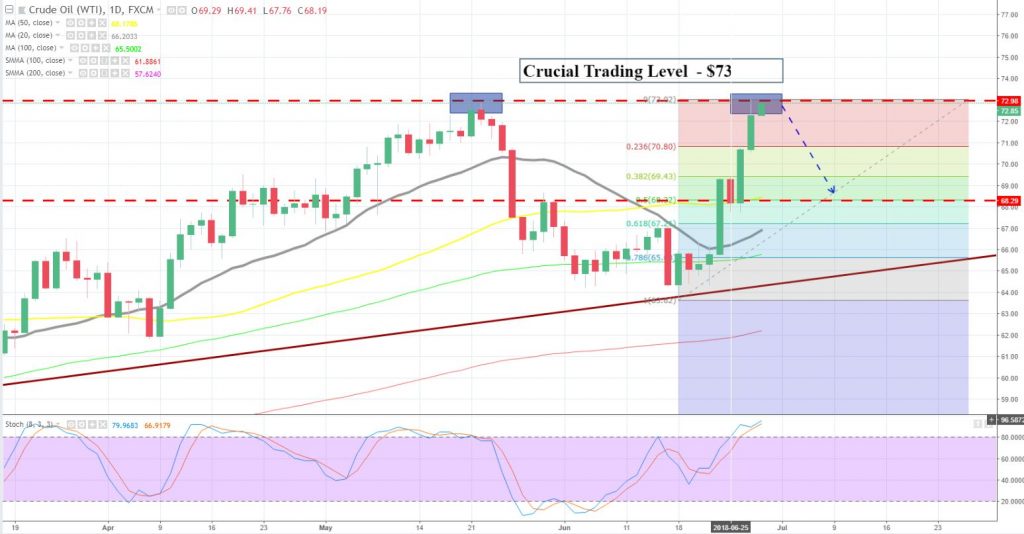
Crude Oil – Daily Chart
Honestly, we need to wait for weekly closing. For instance, the closing of weekly candle below $73 will confirm that traders are respecting this double top level. Otherwise, crude has nice chances to stay bullish until $75.
For now, the major resistance is found at $73 and the break above is likely to lead the oil prices towards $73.75 and $74.20. On the other hand, below $73, oil has a potential to go till $70 and $69.35. All the best!
- Check out our free forex signals
- Follow the top economic events on FX Leaders economic calendar
- Trade better, discover more Forex Trading Strategies
- Open a FREE Trading Account
- Read our latest reviews on: Avatrade, Exness, HFM and XM
Related Articles


Sidebar rates
Related Posts
