Bitcoin Makes A Bullish Reverse but Faces an Obstacle
Bitcoin made a bullish reversal in July climbing around $2,500 higher in what seemed a trend reversal. But, the 50 SMA stuck its foot on the ground on the weekly chart and reversed the reverse. Bitcoin fell back to the lows this month, but at least, the lows held the ground.
The low so far this year has been at around $5,740 according to my cryptocurrency broker, give or take. That took place in June, while the low this month was $5,850. So, the support seems to be holding well for now.
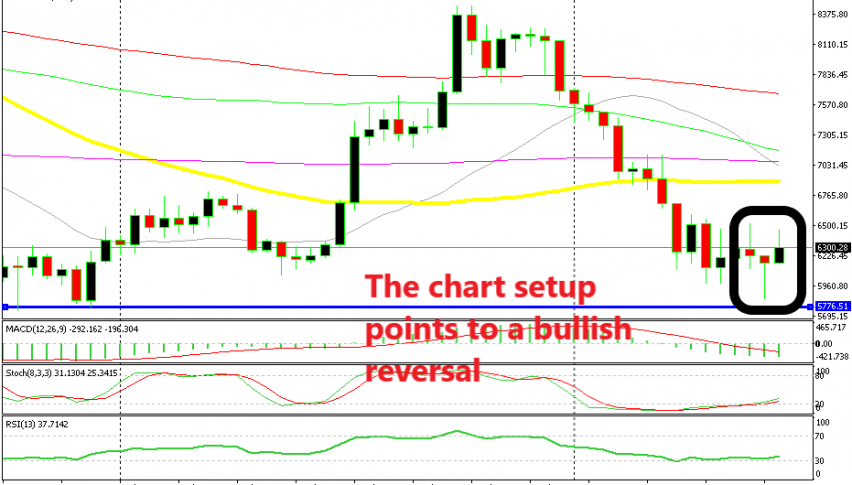
Yesterday, the sellers had a go at the downside, but the buyers came back in and reversed the price. The daily chart setup looks promising to buyers. Yesterday’s candlestick formed a hammer which is a reversing signal. Today’s candlestick looks pretty bullish already, although it remains to be seen how it will close.

The 50 SMA is still not broken until the candlestick closes above it
Switching to the H4 chart, we see that Bitcoin has moved above the 50 SMA (yellow) for a moment, but it reversed and fell back below it. So, this wasn’t a real break but it might turn into one if the buyers push above again. We don’t know if the buyers have that much strength right now, so we will watch the price action since we have a long term buy signal here.


