Stock Markets Can’t Get Their Act Together
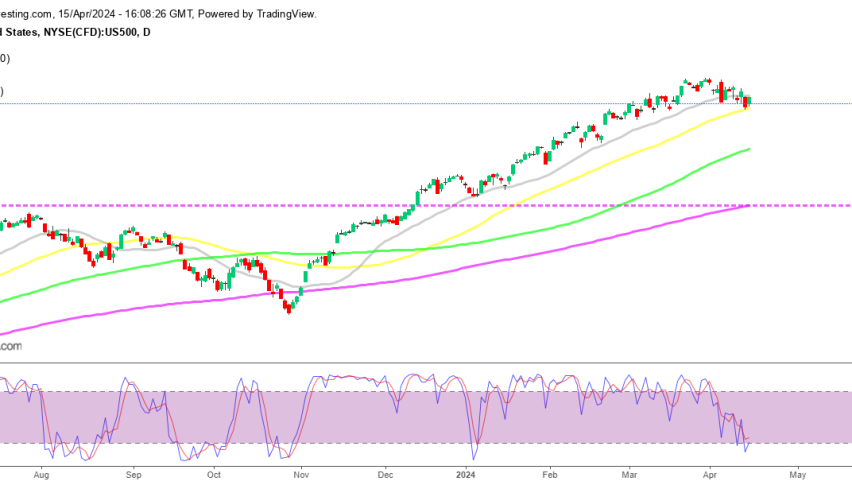
Stock markets have shifted from the bullish trend we have seen in the last several years. They have entered a bearish trend, albeit, the trend on the monthly chart is still bullish as we will see further below in the DAX chart.
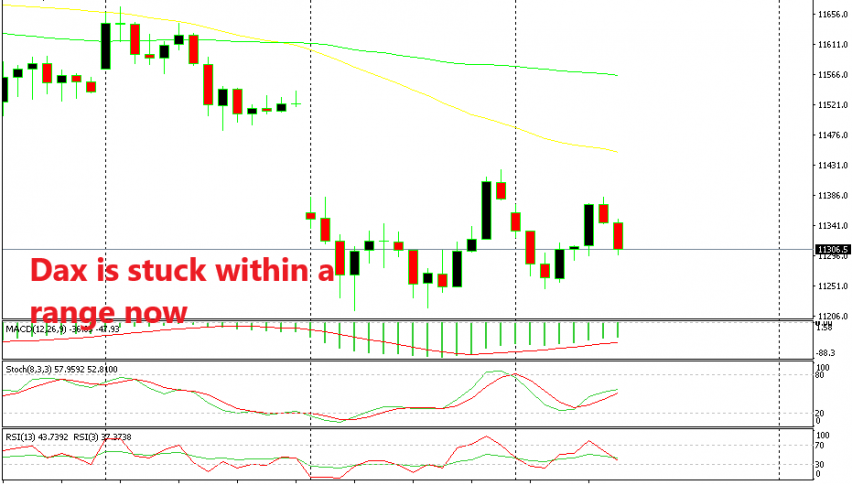
But, as long as intraday traders are concerned, the trend is down as seen from the H1 chart above. That chart is from DAX, but the picture is pretty similar in all major indices across the globe.
As we can observe from that chart, the buyers had a go yesterday, trying to close the bearish gap from the night before. But, they couldn’t close the gap as sellers returned and brought DAX back to the lows.
Today, the buyers had another attempt and they managed to reverse the price above yesterday’s lows, but again they couldn’t close the gap. Now, DAX is heading lower again. Although, it is failing to make new lows either, so if DAX doesn’t make new lows today, then we might try a small long position from around there.

The 50 SMA is still holding on
The reason for this trade idea is the 50 SMA (yellow) on the monthly chart. It has been providing support now. It might get broken, but it is surely proving to be a big obstacle for the sellers. Well, if the price forms a bullish reversal pattern on the H1 chart, then we might open a long signal here trying to get dome pips, but we’ll be careful since the trend is strongly bearish.


