Gold Looking to Breakout – It’s an Ascending Triangle this Time
On the 2- hour chart, gold is testing $1,224 probably for the fifth time now. On Monday, the precious metal soared slightly above $1,224...
During the Asian session, the yellow metal gold held steady as the dollar was pressured by cautious comments about the global economy from Federal Reserve officials.
The market is mostly about technical analysis this week due to the absence of economic events. I’m seeing a really cool trade setup in gold. Check this out…
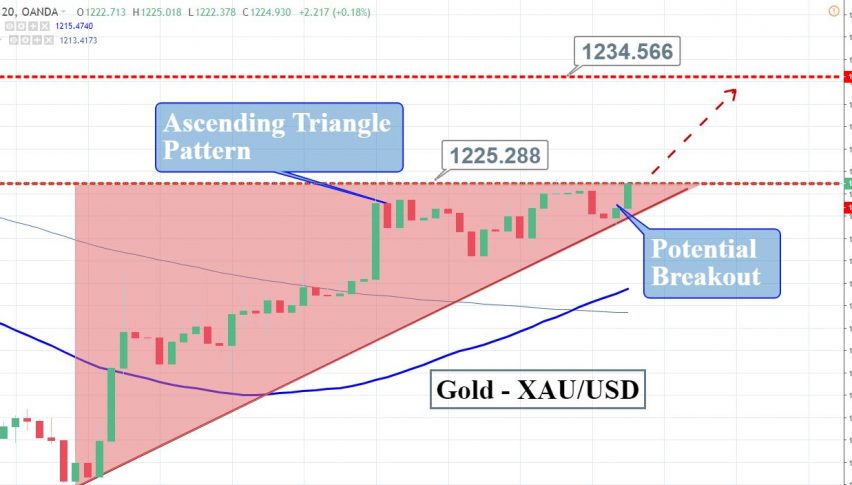
GOLD – XAU/USD Technical Analysis – Ascending Triangle Pattern
On the 2- hour chart, gold is testing $1,224 probably for the fifth time now. On Monday, the precious metal soared slightly above $1,224 to place a high of $1,225.24 but it proved to be a fakeout.
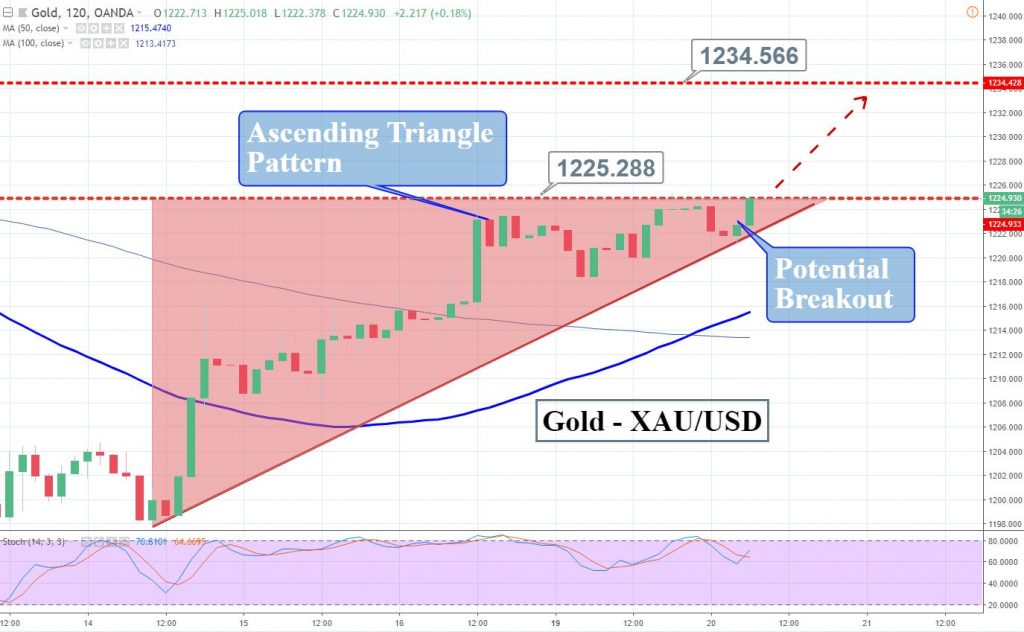
For the moment, the yellow metal is holding below a solid resistance level of $1,224 which is extended by an ascending triangle pattern. As you know, these patterns typically break upward. Thus, the bullish breakout of this level can open further room for buying until $1,234. Whereas, the support prevails at $1,221.
Support Resistance
1219.72 1226.92
1215.31 1229.7
1208.11 1236.9
Key Trading Level: 1222.51
Gold – XAU/USD – Trading Idea
It will be nice to stay bullish above $1,224 with a stop below $1,221 and a take profit of $1,227 and $1,229.
Good luck!
- Check out our free forex signals
- Follow the top economic events on FX Leaders economic calendar
- Trade better, discover more Forex Trading Strategies
- Open a FREE Trading Account
- Read our latest reviews on: Avatrade, Exness, HFM and XM
Related Articles

Sidebar rates
Related Posts
