Is the $50 Level the Ultimate Sell Point for WTI Crude Oil?
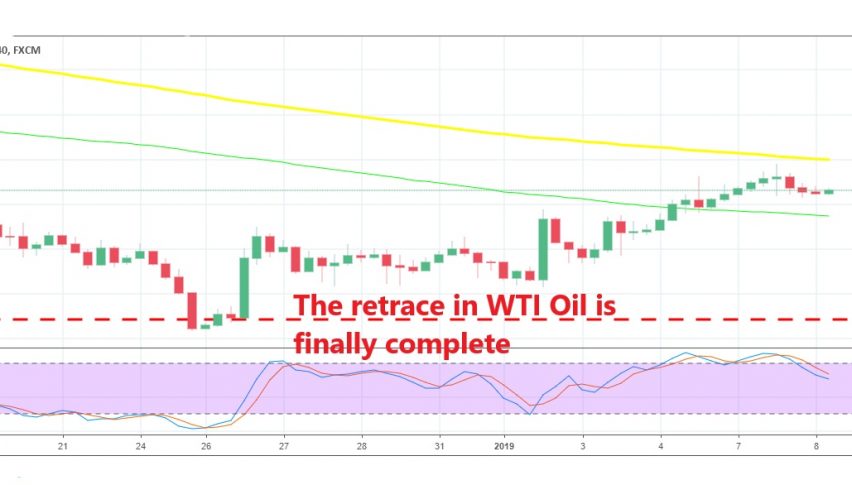
Crude Oil has been retracing higher during the holidays but the retrace seems complete now.
Crude Oil has been on a steep downtrend since the beginning of October when it reversed after being in an uptrend for more than two years. US WTI crude has lost around $35 in three months since it reversed from $77 in early October and bottomed out above $42 during Christmas Eve.
But, it made a sudden reversal on Boxing Day when the liquidity in the financial markets was very thin. Since then, WTI crude has climbed nearly $8 and yesterday, it got pretty close to the $50 level. This is a big round level and used to be a strong support area, so now it seems that this level has turned into a resistance zone. Yesterday, Oil turned bearish for some time after it got close to this level, so it is a big level in everyone’s mind.
The price formed a doji on the H4 chart and lost more than 100 pips. Despite the $50 level being a strong support/resistance area, we can also find the 50 SMA on the H4 chart right at this level. Yesterday was the perfect chance to sell Oil after the doji candlestick, but hopefully we will get another chance up there to open a long term sell forex signal. A sell trade below $50 offers a pretty good risk/reward ratio.
If you place the stop a dozen pips above $51 and target $45 and then $43, it is a pretty good trade. The stochastic indicator is overbought on the H4 and the daily chart which means the retrace is complete, so I’m beating myself up for missing that opportunity yesterday, but perhaps we will get another chance today.
- Check out our free forex signals
- Follow the top economic events on FX Leaders economic calendar
- Trade better, discover more Forex Trading Strategies
- Open a FREE Trading Account
- Read our latest reviews on: Avatrade, Exness, HFM and XM
Related Articles

Sidebar rates
Related Posts
