The 50 SMA Keeping USD/JPY in Check as it Turns From Support to Resistance
USD/JPY has been finding resistance at the 50 SMA, which is helping keep this pair down
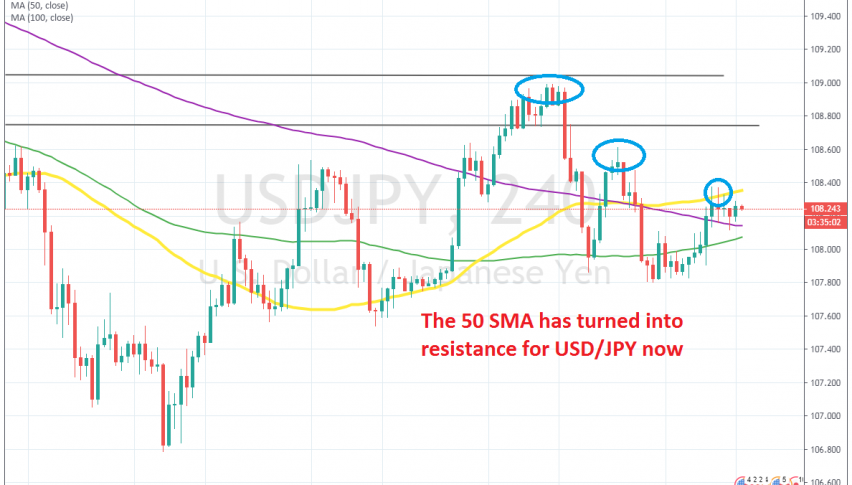
[[USD/JPY]] turned bearish about three months ago at the end of April after the escalation of the trade war between US and China and other geopolitical tensions which hurt the sentiment and sent safe havens higher. During the previous few weeks though, we have seen this pair turn bullish and climb from below 108 to 109, but that was just a retrace, because the main trend is still bearish if you check the daily chart on your platform.
USD/JPY reached the 50 SMA on the daily time-frame last week and reversed back down. Buyers tried to turn this pair bullish again last week after the price bounced off the 100 SMA (green) but thy gave up at 108.60, making a lower high. This week, they tried again, but it seems like the retrace higher has ended at the 50 SMA (yellow).
This moving average has been providing resistance to the pair in the last two days on the H4 chart. The price has formed a few doji candlesticks below this moving average which are reversing signals and now the sellers are coming back. Although, they have to push below the 100 SMA (green) if the downtrend is to resume.
We went short on this pair on Monday and the 50 SMA is helping our trade here as it is keeping USD/JPY down. Now we are waiting for the downtrend to resume since this pair has made three lower highs, which is an indication that the pressure is still on the downside.
- Check out our free forex signals
- Follow the top economic events on FX Leaders economic calendar
- Trade better, discover more Forex Trading Strategies
- Open a FREE Trading Account
- Read our latest reviews on: Avatrade, Exness, HFM and XM
Related Articles

Sidebar rates
Related Posts
