EUR/USD Still Can’t Push Above the 100 SMA
EUR/USD was bullish today, but the 100 SMA stopped the climb and reversed the price down once again
[[EUR/USD]] has been on a bearish trend for a long time, even more so than commodity currencies recently. Although, last Thursday we saw a swift reversal after the ECB (European Central Bank) meeting. The ECB cut deposit rates further in negative territory and this pair lost more than 100 pips immediately. But the support at 1.0920s held and the price bounced higher off that area, given that the ECB didn’t throw the kitchen sink at the Euro.
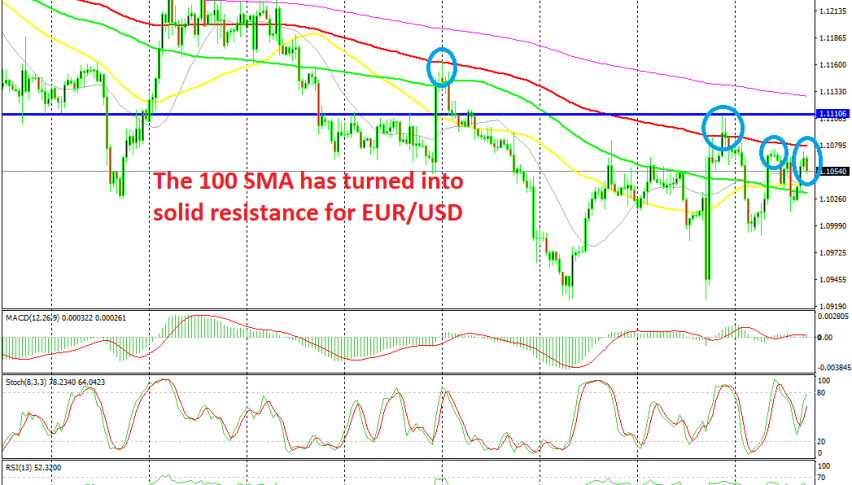
EUR/USD surged 200 pips higher in the following sessions, but the price found resistance at the 100 SMA (red) on the H4 chart. It did pierce the 100 SMA briefly, but the price returned back below it pretty quickly, also helped by the area around 1.11 which seems to have turned into resistance for this pair, so it didn’t really count as a break.
This week, EUR/USD has tried to push higher, but the 100 SMA has stopped it from doing so twice, once yesterday before the FED meeting and once today. So, it seems like this moving average has turned into solid resistance for EUR/USD. We might open a sell signal on this pair, but we missed the chance when the price was at the 100 SMA, so I will wait for a retrace higher before going short.
- Check out our free forex signals
- Follow the top economic events on FX Leaders economic calendar
- Trade better, discover more Forex Trading Strategies
- Open a FREE Trading Account
- Read our latest reviews on: Avatrade, Exness, HFM and XM
Related Articles
Sidebar rates
Related Posts
