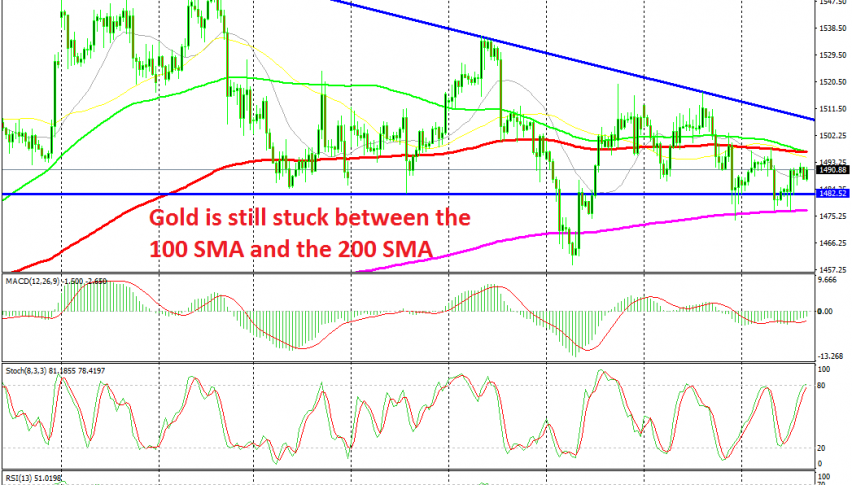
Gold Still Remains Stuck Between 2 MAs
Gold has been stuck between two MAs for more than a week.
GOLD has had a great year, especially in summer, surging by around $280. The weakening global economy and the escalating trade war hurt the risk sentiment in financial markets, benefiting safe havens such as the JPY and Gold. But in the last two months Gold has lost its mojo a bit.
It has made lower highs, forming a triangle with the support at $1,482. That triangle was broken earlier this month as hopes for a partial trade deal between US and China increased, improving the sentiment. But Gold turned higher again and entered the triangle again.
Although, in the last week or so, Gold hasn’t been trading the triangle any more. It has instead traded two moving averages, the 100 SMA (red) which is acting as resistance at the top on the H4 chart and the 200 SMA (purple) at the bottom,acting as support. Yesterday Gold bounced off the 200 SMA but we lost that opportunity. Today, we will try to trade these moving averages selling near the top and buying near the bottom.
- Check out our free forex signals
- Follow the top economic events on FX Leaders economic calendar
- Trade better, discover more Forex Trading Strategies
- Open a FREE Trading Account
- Read our latest reviews on: Avatrade, Exness, HFM and XM
Related Articles


Sidebar rates
Related Posts
Ava

