Buying the Pullback in EUR/USD at the 50 Hourly SMA
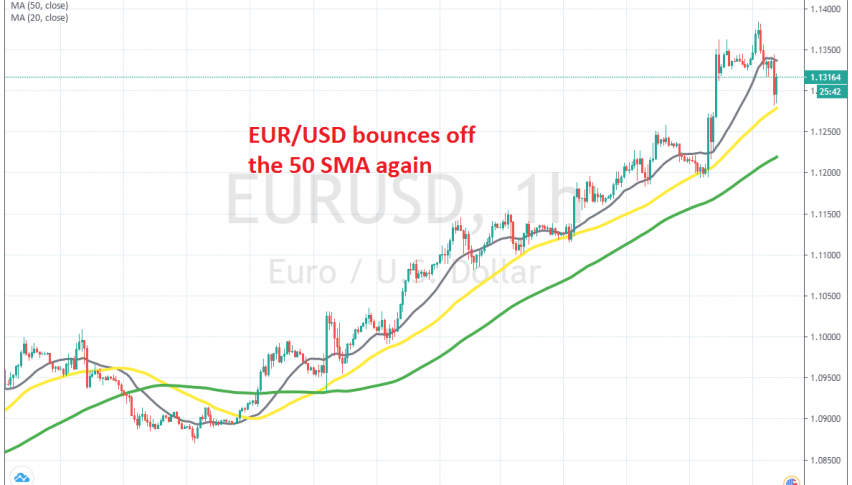
EUR/USD has bounced off the 50 SMA again on the H1 chart, after we went long
[[EUR/USD]] turned bullish by the middle of May, after trading sideways for a couple of months. But, the bearish trend only picked up pace by the last week of May, after this pair broke above the 100 SMA on the daily chart and the buying pressure has continued this week as well.
This pair climbed above the moving averages on the H1 chart two weeks ago and these MAs have turned into solid support for EUR/USD since then. You can see that the buying pressure is pretty strong for this pair, since the smaller moving averages such as the 20 SMA (grey) and the 50 SMA (yellow) in particular are providing support.
The 50 SMA has been the ultimate support indicator for EUR/USD, which has been pushing this pair higher. Earlier today this pair retraced around 100 pips lower and the positive US employment report gave it another push lower. But the 50 SMA held again as support and we decided to go long from there. Now the price has bounced back up and we are around 20 pips in profit so far.
- Check out our free forex signals
- Follow the top economic events on FX Leaders economic calendar
- Trade better, discover more Forex Trading Strategies
- Open a FREE Trading Account
- Read our latest reviews on: Avatrade, Exness, HFM and XM
Related Articles


Sidebar rates
Related Posts
