Silver Trading Between Moving Averages on the Daily Chart
Silver has bounced off the 100 daily SMA today and is facing the 50 SMA now
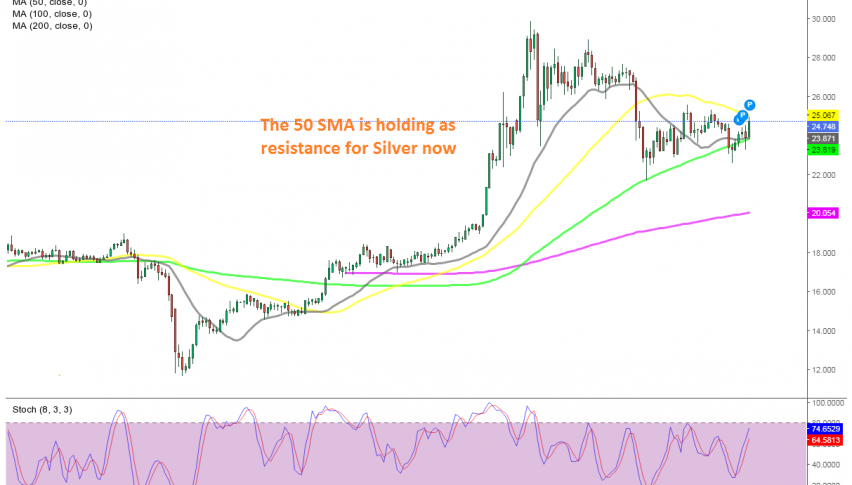
Just like GOLD , Silver turned quite bullish since the middle of March, surging from 12 and getting pretty close to 30. But in the first week of August we saw a swift reversal, as the sentiment improved and the demand for safe havens declined, after a set of positive economic data.
The 20 SMA (grey) turned into support for some time, but it was eventually broken during the second leg down. Although, the 100 SMA (green) held the decline on the daily chart. This moving average has turned into the ultimate support for SILVER , pushing the price higher since then.
Today we are seeing a strong bounce off the 100 SMA, as the USD continues to decline on US elections standoff. But, XAG/USD faces the 50 SMA (yellow) now. This moving average didn’t do much as support when Silver was on the way down, but it might turn into resistance now. So, let’s see; if it hold we might try a small short term sell signal, although the situation is really uncertain, with the elections in the US heading to the courts.
- Check out our free forex signals
- Follow the top economic events on FX Leaders economic calendar
- Trade better, discover more Forex Trading Strategies
- Open a FREE Trading Account
- Read our latest reviews on: Avatrade, Exness, HFM and XM
Related Articles

Sidebar rates
Related Posts
