Will EUR/JPY Pullback at the 200 SMA?
EUR/JPY run to the 200 SMA today, where it is reversing down
EUR/JPY turned quite bullish from May until the end of August when this pair climbed briefly above 127. During the climb, the 20 SMA (grey) was providing support on the daily chart, but it got broken in the first week of September, when the trend started to reverse down.
The 50 SMA (yellow) and the 100 SMA (green) were broken but the 200 SMA (purple) held as support last week on that time-frame chart and this week EUR/JPY is bouncing higher, as the Euro gains some momentum on the back of the weak USD due to the presidential elections.
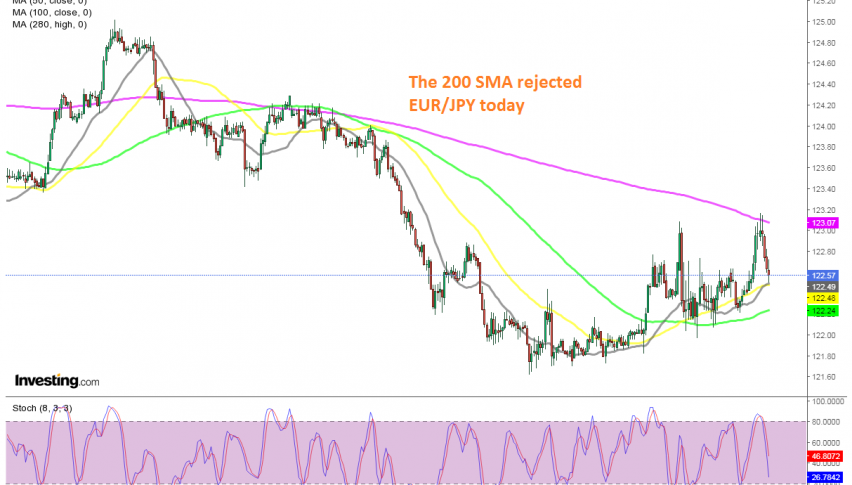
As a result, this forex pair has climbed around 150 pips this week and yesterday the 100 SMA (green) turned into support on the H1 chart, as shown above. Today though, the 200 SMA (purple) is acting as resistance. The price pierced this moving average a couple of times, but it retreated back below it pretty quickly, which shows that there’s some strong selling pressure up there.
EUR/JPY has formed a few doji candlesticks below the 200 SMA which are bearish reversing signals. So there’s a strong chance that we see a pullback to the 100 SMA (green) soon. We are trying to get short on this pair and might do so soon, placing a stop above today’s highs, so follow us on our forex signals page for live trade ideas.
- Check out our free forex signals
- Follow the top economic events on FX Leaders economic calendar
- Trade better, discover more Forex Trading Strategies
- Open a FREE Trading Account
- Read our latest reviews on: Avatrade, Exness, HFM and XM
Related Articles


Sidebar rates
Related Posts
