Cryptocurrencies Retracing Lower Today, After the Surge
Cryptocurrencies are pulling back today after the recent surge
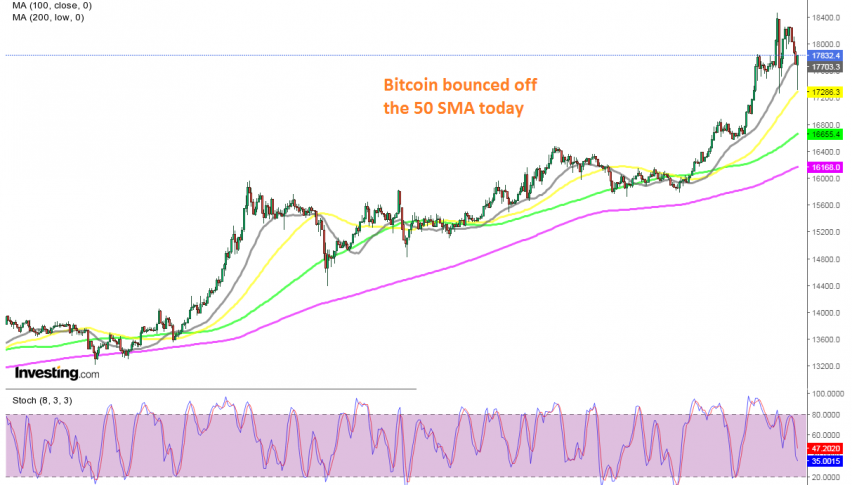
Bitcoin H1 Analysis
BITCOIN has been absolutely surging during this month, leading the crytpocurrency market higher. it was trading above $13,000 in the first few days of this month after a small pullback lower, but the 200 SMA (purple) was holding as support, despite being pierced briefly, which didn’t count as a break. Since then, the buying pressure has been quite strong and moving averages have been providing support during pullbacks, sending the price higher.
This week the uptrend has picked up pace further, as shown by the 20 SMA (grey) which turned into support again. Earlier today, we saw a pullback lower from $18,450 to $17,350, but the decline stopped right at the 50 SMA (yellow) on the H1 chart. The price bounced off that moving average and is around $500 higher now. So, the trend is bullish here and pullbacks lower to the MAs are good opportunities to go long. We might open a buy signal here.
Ethereum Lagging But Remains Bullish

ETH/USD heading for the 50 SMA
ETHEREUM has also been bullish since the middle of March this year, but it was lagging behind, compared to Bitcoin. It climbed to $485 by September 1 but then pulled back lower, although moving averages held as support on the daily chart and they were pushing Ethereum higher, until early this month, when the price surged higher again. On the H4 chart, the 200 SMA (purple) was providing support for ETH/USD early this month during the retrace lower, but as the bullish trend resumed, the 20 SMA (grey) turned into support. Today we have seen Ethereum retrace higher, heading towards the 50 SMA (yellow) which looks like a good place to go long.
Litecoin Heading for the 20 SMA

Will the 20 SMA catch up soon?
LITECOIN dived early this year, from above $80 to $24. it started reversing higher after that, but the it traded sideways instead, with the 200 SMA (purple) providing resistance until the last week of July. The buying picked up back then and the 200 SMA was broken. The 20 SMA turned into support for LTC/USD and the price increased to $76.50. On the H4 chart, the picture is similar, with the 200 SMA turning from resistance into support in October, while the 20 SMA (grey) turned into support this month, as the bullish trend picked up pace. Litecoin has been retracing $6 lower, but the 20 SMA is waiting to provide support again. If it holds and we see a bullish reversing signal forming above it, then we might buy Litecoin.
Dash/USD Trading Range-Bound

Let’s see if moving averages will turn into support for Dash
The Dash coin was looking pretty good at the beginning of this year, when it surged from around $40 to above $140. But, the coronavirus crash came by the middle of February and DASH/USD tumbled lower, falling below $40. But, the decline stopped in the beginning of March and the trend reversed, although it was lacking strength. The 100 SMA was providing resistance for a while, but it was eventually broken and the price moved above $100 briefly in the first week of August. DASH/USD couldn’t hold on to the gains though and it reversed back down. It has been bearish since then, while other cryptos have been surging higher, apart from the last two weeks, which points down for Dash. Ripple is a little more bullish than DASH, although XRP/USD is trading in a triangle, so we will see if the recent bullish move will be strong enough to break above the triangle.
- Check out our free forex signals
- Follow the top economic events on FX Leaders economic calendar
- Trade better, discover more Forex Trading Strategies
- Open a FREE Trading Account
- Read our latest reviews on: Avatrade, Exness, HFM and XM
Related Articles


Sidebar rates
Related Posts
