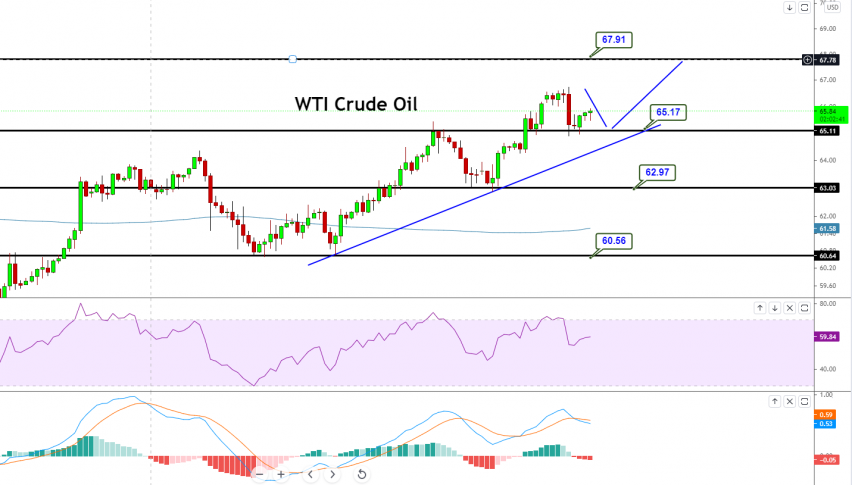
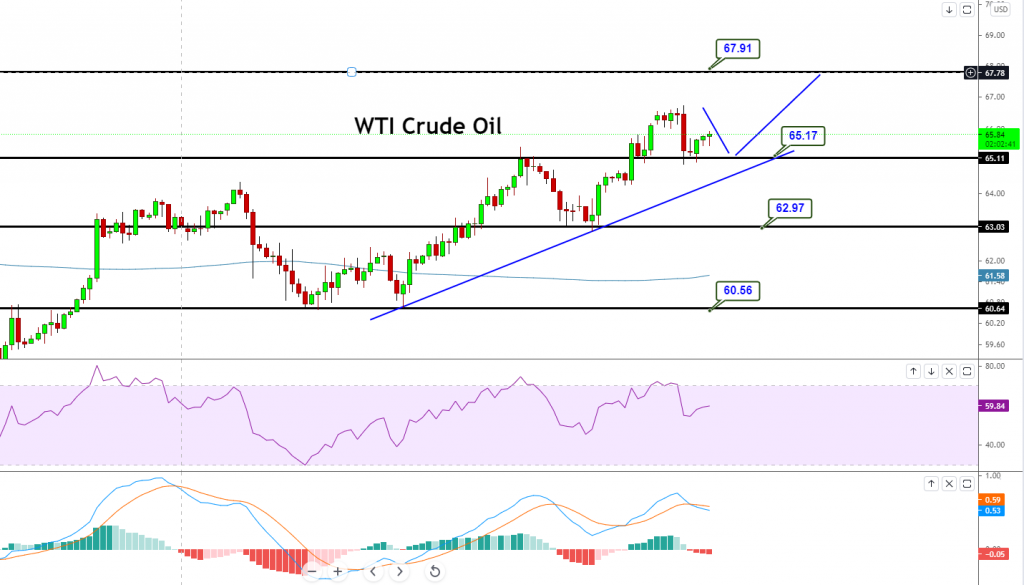
WTI Crude Oil Violates Ascending Triangle Pattern – Buy Signal Update!
Crude oil prices were closed at $65.12 after placing a high of $66.75 and a low of $64.92. Oil rose to its highest level since March 8 on
Crude oil prices were closed at $65.12 after placing a high of $66.75 and a low of $64.92. Crude oil rose to its highest level since March 8 on Wednesday in the first half of the day; however, it started posting losses and ended its day on a bearish note. After rising for three consecutive sessions, WTI oil dropped on Wednesday as risk-off market sentiment emerged and raised fears of reduced oil demand. During the first half of the day, oil prices moved higher after the Energy Information Administration announced a crude inventories’ draw of 8 million barrels for the week to April 30.
The American Petroleum Institute estimated a weekly draw of 7.68 million barrels a day earlier, and the EIA reported a moderate build of 100,000 barrels for the previous week. This week, the EIA had forecast 1.9M barrel drop in crude oil inventories, but they came in as -8.0M barrels. The crude oil inventory draw of 8 million added strength in oil prices on Wednesday.
On the data front, at 17:15 GMT, the ADP Non-Farm Employment Change in April reduced to 742K against the projected 872K and weighed on the U.S dollar that capped further losses in crude oil. At 18:45 GMT, the Final Services PMI in April increased to 64.7 against the anticipated 63.1 and showed an expansion in the service industry that pushed the dollar higher and added losses in crude oil. At 19:00 GMT, the ISM Services PMI fell to 62.7 against the predicted 64.2 and weighed on the U.S. dollar, limiting the losses in crude oil.
In the second half of Wednesday, crude oil prices faced heavy pressure after the global count of coronavirus infections reached above 154 million due to rising infection cases in India. The total tally of COVID-19 cases in India reached 20.6 million. On Wednesday, World Health Organization also reported that India accounted for about 46% of global COVID-19 cases last week.
India is the second-largest importer of crude oil, and the rising number of coronavirus infections in the country has raised fears for reduced demand for crude oil. The news that India accounted for 46% of global cases and 25% of global deaths reported increased WTI crude oil prices last week. The daily infections in India rose by 382,315 on Wednesday for a 14thstraight day of infections over 300,000 as per health ministry data. The rising number of infection cases in India and across the globe due to the third wave of coronavirus raised risk-off market sentiment. It supported the safe-haven currency U.S. dollar that also added in the declining prices of WTI crude oil on Wednesday.
Daily Technical Levels
Support Resistance
64.45 66.28
63.77 67.43
62.62 68.11
Pivot Point: 65.60
The technical side of the WTI hasn’t changed a lot as crude oil is trading slightly bullish, holding a tight trading range of 66.55 – 63.08 level. The technical indicators suggest a strong bullish bias, as the MACD and RSI are tossing above mid-levels, indicating a bullish bias among investors. On the higher side, a bullish breakout of 66.55 levels can drive buying trends until 67 levels. At the same time, the violation of 63 support can lead the WTI price lower towards 62 and even 60. Let’s keep an eye on 64 levels today, as selling can be seen below this and buying above the same level. Good luck!
- Check out our free forex signals
- Follow the top economic events on FX Leaders economic calendar
- Trade better, discover more Forex Trading Strategies
- Open a FREE Trading Account
- Read our latest reviews on: Avatrade, Exness, HFM and XM
Related Articles


Sidebar rates
Related Posts
