WTI Crude Oil Tosses Near $64 – Upward Trendline Supports!
WTI Crude oil closed at $64.92 after placing a high of $65.75 and a low of $63.95. It continued its bearish streak for the fourth straight
Written by:
Arslan Ali Butt
•
Tuesday, May 11, 2021
•
2 min read
•
Last updated: Tuesday, May 11, 2021

WTI Crude oil closed at $64.92 after placing a high of $65.75 and a low of $63.95. It continued its bearish streak for the fourth consecutive session on Monday and extended its losses. WTI Oil prices fell on Monday and gave up all earlier gains amid a cyberattack that forced the shutdown of significant fuel pipelines in the United States. Colonial Pipeline in the U.S. said that its main fuel lines remained offline after the attack that shut the system; however, some smaller lines between terminals and delivery points started operations.
The Commerce Secretary Gin Raimond said that the White House was working closely with Colonial to help it to recover as fixing the pipeline was a top priority for the Biden administration. This bad news and the rising infection rate in India kept crude oil under heavy pressure. The pandemic situation in India worsened as death rates and infection rates held close to the record daily highs on Monday. Another reason behind the latest slump in oil prices was the recent declaration by the World Health Organization. On Monday, the global body said it had changed its classification of the B.1.617 coronavirus variant first found in India last October from a variant of interest to a variant of concern.
India has seen massive infections and death rates though observers say actual numbers were far higher. The WHO thinks that the variant may be more contagious than the original form and perhaps resistant to vaccines. This news added in the risk-off market sentiment and weighed on the Crude oil prices. Furthermore, the Jordanian Ministry of Energy and Mineral Resources has launched a tender to transport crude oil by road from the loading site in Iraq to the Jordanian Petroleum Refinery site at 10,000 barrels per day.On the U.S. front, the greenback was strong on board as the U.S. Dollar Index (DXY) recovered some of its losses and reached 90.34 level, whereas the U.S. Treasury bond yield rose to 1.60% and added strength in the rising U.S. dollar. Crude oil and U.S. dollar have a negative correlation which means, the rising prices of the U.S. dollar added pressure on crude oil. The dollar was high and recovering as worries about accelerating inflation dragged the share market value and benefitted the greenback.

Daily Technical levels
Support Resistance
65.23 65.62
65.00 65.78
64.84 66.01
Pivot Point: 65.39
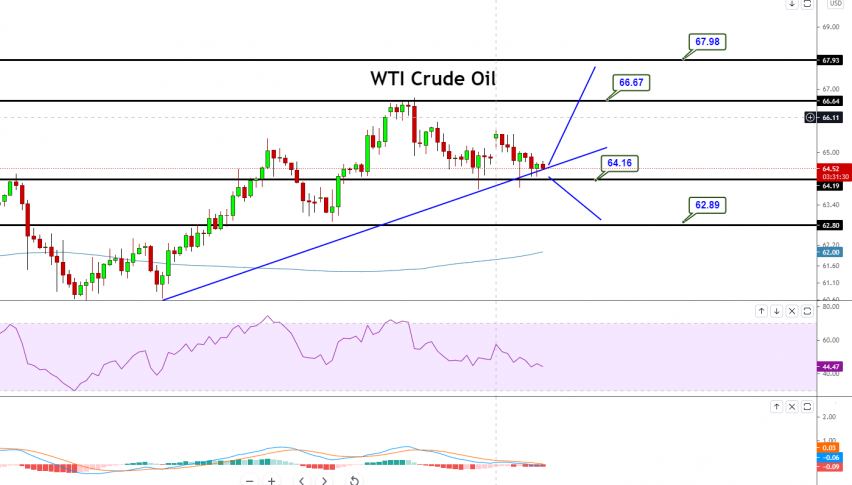
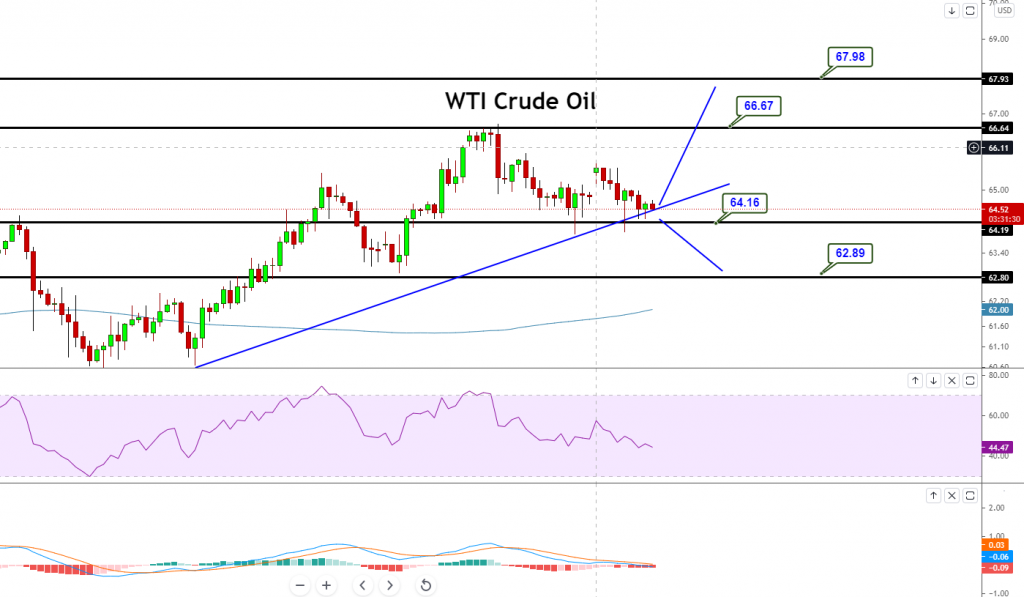
WTI Crude oil is trading slightly bearish, holding a tight trading range of 66.55 – 63.08. The
technical indicators suggest a strong bullish bias, as the MACD and RSI are tossing above mid-levels, indicating a bullish bias among investors. On the higher side, a bullish breakout of 66.55 levels can drive buying trends until 67. At the same time, the violation of the support at the 64.16 level can trigger selling until 62.89 and 62. Let’s keep an eye on 64.16 levels today, as selling can be seen below this and buying above the same level. Good luck!
Arslan Ali Butt
Lead Markets Analyst – Multi-Asset (FX, Commodities, Crypto)
Arslan Ali Butt serves as the Lead Commodities and Indices Analyst, bringing a wealth of expertise to the field. With an MBA in Behavioral Finance and active progress towards a Ph.D., Arslan possesses a deep understanding of market dynamics.
His professional journey includes a significant role as a senior analyst at a leading brokerage firm, complementing his extensive experience as a market analyst and day trader. Adept in educating others, Arslan has a commendable track record as an instructor and public speaker.
His incisive analyses, particularly within the realms of cryptocurrency and forex markets, are showcased across esteemed financial publications such as ForexCrunch, InsideBitcoins, and EconomyWatch, solidifying his reputation in the financial community.