Ripple Price Forecast – XRP/USD Sideways Trading in Play, Brace for a Breakout!

XRP/USD closed at $0.94639 after placing a high of $0.94639 and a low of $0.92290. It rose and recovered a minor portion of its previous

Ripple - XRP/USD Chart


The XRP/USD closed at $0.94639, after placing a high of $0.94639, and a low of $0.92290. The XRP/USD currency pair rose and managed to recover a minor portion of its previous losses. The cryptocurrency dropped for two consecutive sessions but reversed its course on Sunday. On Friday, the lawyers representing Ripple Labs, its CEO Brad Garlinghouse and co-founder, Chris Larsen, filed a motion to compel the SEC to produce two sets of documents that the company requested earlier this year. Ripple demanded the documents related to the SEC’s communications with third parties regarding Bitcoin and Ethereum, to disclose the reasons why the agency considers bitcoin and ether to be commodities rather than securities, like XRP.

However, despite repeated demands, the SEC continued to refuse to provide documents on internal communications regarding the cryptocurrencies BTC, ETH and XRP. The motion to compel SEC to hand over the documents moved back and forth between the two parties and Judge Netburn. This back and forth movement in the SEC lawsuit kept the prices of the Ripple coin, XRP, under pressure over the weekend.

Meanwhile, the declining prices of the US dollar also played an essential role in raising the prices of XRP/USD over the weekend. The greenback came under heavy pressure after the US Dollar Index (DXY) dropped to the 90.03 level, followed by the declining US Treasury Yields, amid poorer-than-expected economic data released by the US Labor Department on Friday, regarding job creation. The weak US dollar helped the crypto pair recover some of its previous day’s losses on Sunday.

Ripple - XRP/USD Chart

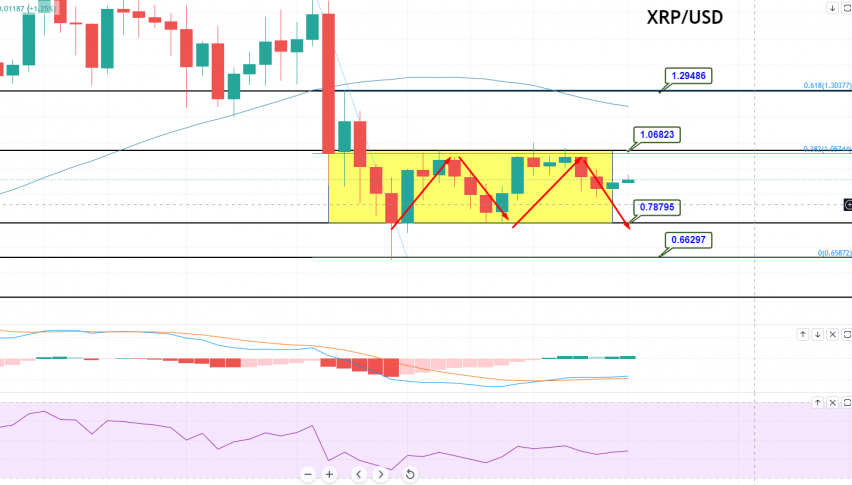
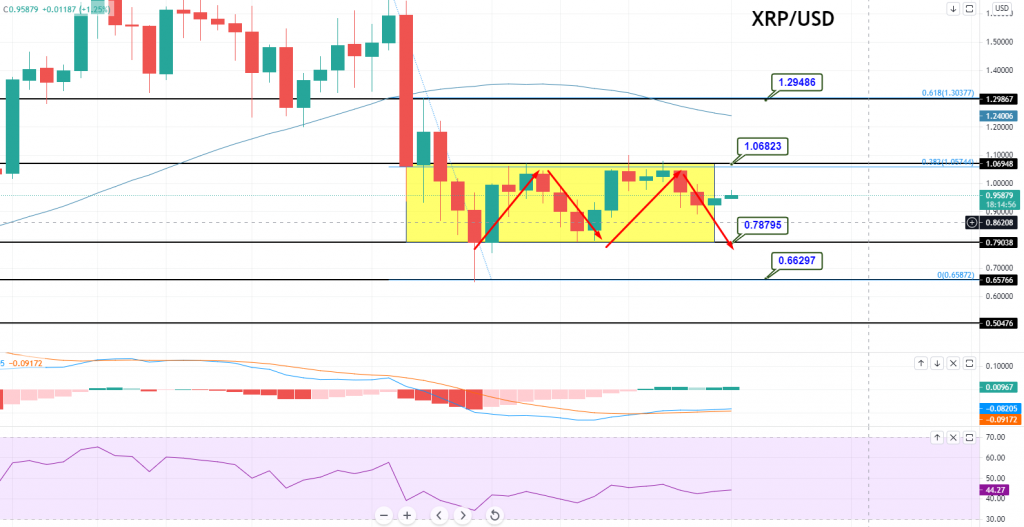
XRP/USD Daily Technical Levels

Support           Resistance
0.93073          0.95422
0.91507          0.96205
0.90724          0.97771
Pivot Point:   0.93856

The XRP/USD pair is trading sideways, maintaining a wide trading range between 1.07815 and 0.79788. A bullish crossover at the 1.0781 level could drive further buying in Ripple, until next resistance area of 1.2948, as this marks the 61.8% Fibonacci retracement level. On the lower side, the support continues to hold around the 0.7978 area. The MACD and RSI support a bullish trend, while the EMA supports a  selling bias. The idea is to take a buy trade upon breakout of the 1.0781 level. Good luck!


ABOUT THE AUTHOR See More
Arslan Butt
Index & Commodity Analyst
Arslan Butt serves as the Lead Commodities and Indices Analyst, bringing a wealth of expertise to the field. With an MBA in Behavioral Finance and active progress towards a Ph.D., Arslan possesses a deep understanding of market dynamics.His professional journey includes a significant role as a senior analyst at a leading brokerage firm, complementing his extensive experience as a market analyst and day trader. Adept in educating others, Arslan has a commendable track record as an instructor and public speaker.His incisive analyses, particularly within the realms of cryptocurrency and forex markets, are showcased across esteemed financial publications such as ForexCrunch, InsideBitcoins, and EconomyWatch, solidifying his reputation in the financial community.

Related Articles

Comments

0 0 votes
Article Rating
Subscribe
Notify of
0 Comments
Oldest
Newest Most Voted
Inline Feedbacks
View all comments

HFM

Doo Prime

XM

Best Forex Brokers