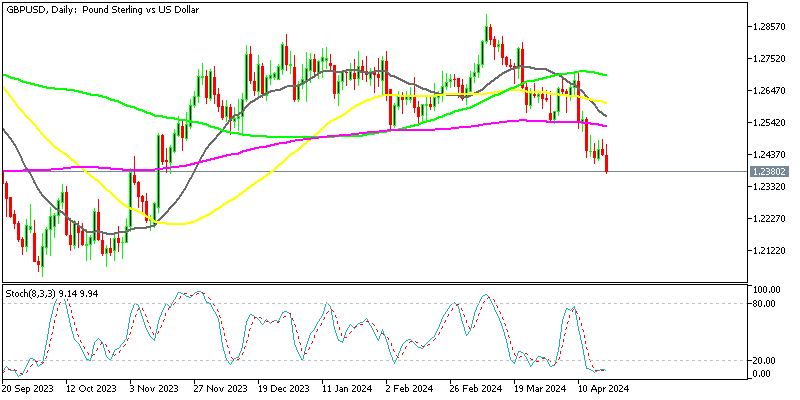
During Tuesday’s early Asian trading hours, the GBP/USD currency pair failed to extend its previous two-day winning streak, drawing some offers well below the 1.4180 level. However, the selling bias surrounding the currency pair was mainly supported by the uncertainties over the UK government’s plan to reopen the economy on June 21, in light of the spread of the Delta variant of the coronavirus. Meanwhile, the indications that the UK’s relationship with the European Union has been putting some additional downward pressure on the pound sterling has turned out to be one of the key factors that is undermining the GBP/USD currency pair, through the first half of the trading action. On the contrary, the weakness of the broad-based US dollar, triggered by a combination of several factors, has helped to ease the bearish pressure on the GBP/USD pair. The GBP/USD currency pair is currently trading at 1.4179, and consolidating in the range between 1.4177 and 1.4187.
The global equity market failed to put a stop to the bearish performance of the previous day, remaining depressed on the day, as the uncertainties over the plans for the reopening of the UK economy and renewed fears of a surge in COVID-19 cases in Australia kept weighing on the market trading sentiment. In addition to this, the sluggish trading mood could also be associated with the cautious sentiment ahead of the upcoming Fed action. Meanwhile, the souring relationship between Britain and the European Union is weighing heavily on the risk sentiment. As per the latest report, the EU ambassador to the UK said on Sunday, that the level of trust between the two powers was low.
Two UK Cabinet Ministers, Chris Witty and Sir Patrick Vallance, are considering a 15-day delay in the UK’s plan to ease the lockdown, which keeps raising doubts about economic recovery in the UK. This turned out to be one of the key factors that kept the GBP/USD currency pair under pressure. Despite the risk-off market mood, the bearish bias in the broad-based US dollar continued, and the currency remained depressed on the day, as the recently released US jobs data put pressure on the greenback, and prompted investors into speculating that the jobs growth was not strong enough to raise expectations for a tightening of monetary policy by the US Federal Reserve. Meanwhile, the less favorable non-farm payroll data also significantly undermined the US dollar. However, the losses in the greenback made a significant contribution towards preventing deeper losses in the
GBP/USD currency pair. The US dollar index, which measures the greenback against the euro and five other major currencies, fell under the critical 90 level, coming in at just 89.880.There is not any critical economic data due for release in the UK. Therefore, traders will pay attention to the Goods Trade Balance and the NFIB Business Optimism Index from the US, which are expected to be released later in the day, in order to gain fresh direction. Traders will also keep their eyes on incoming Brexit-related headlines, to grab some short-term opportunities.

GBP/USD Daily Support and Resistance
S3 1.3899
S2 1.4016
S1 1.4062
Pivot Point 1.4133
R1 1.4179
R2 1.425
R3 1.4367The
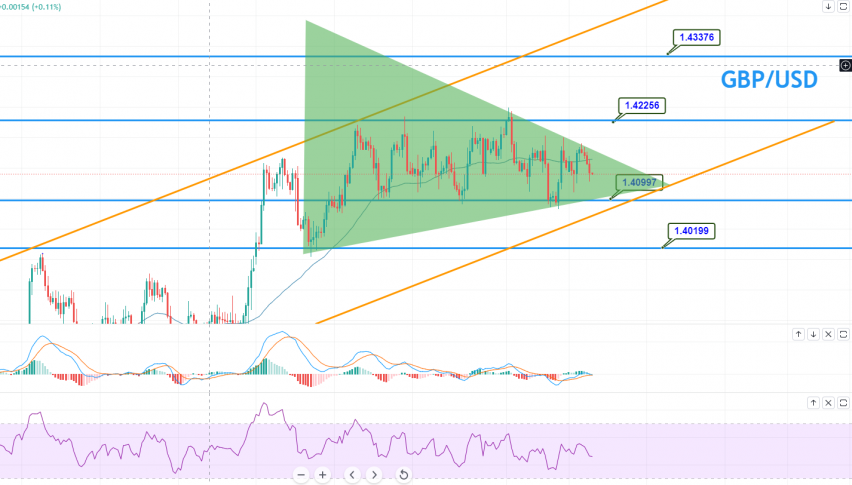
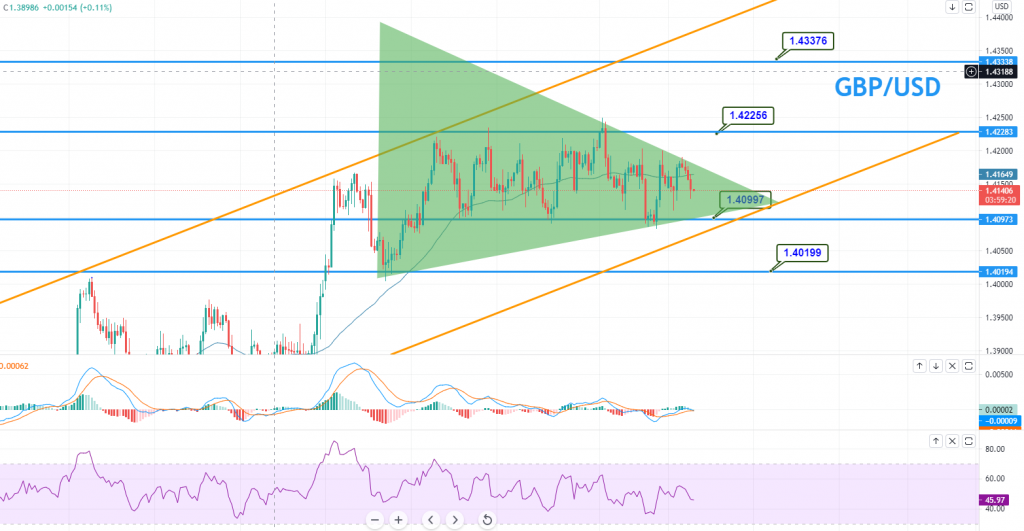
GBP/USD pair is trading at the 1.4145 level, gaining immediate support at 1.4099. Closing of candles below this level might drive selling until the 1.4019 support area. Overall, the pair is gaining support at 1.4099, extended by an upward channel on the four-hourly time-frames. Besides this, the RSI and MACD are also trading below 50 and 0 respectively; therefore, the odds of a continuation of the bearish trend remain pretty solid. As a result, we might look for a sell trade in Sterling today. Good luck and stay tuned!
