MAs Keeping Ethereum Down, but the Downtrend in Hedera is More Consistent
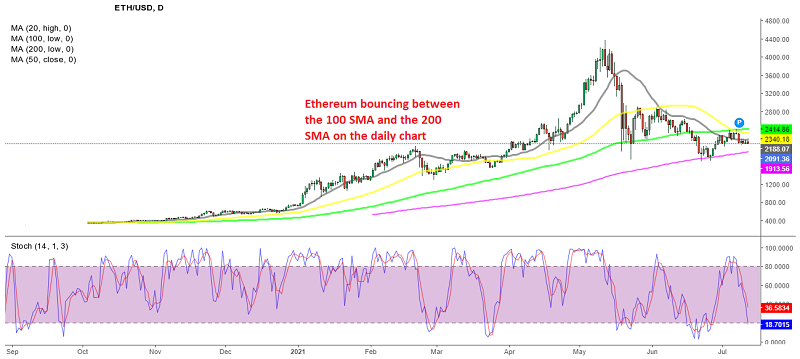
Ethereum was the market leader for a brief period, from April until May, as it kept making new highs, while Bitcoin was stagnating. The ETH/USD reached a high of $4,380 by the middle of May, but it crashed in a little over two weeks, falling below $1,800, when China declared war on cryptocurrencies, as it began the push for the digital Yuan, which is the real reason behind the war.
Ethereum crashed to the 100 SMA (green) on the daily chart, which turned into support for exactly a month, despite being pierced. But it was broken during the second wave of crypto selling in June. The 200 daily SMA (purple) took its place and the ETH/USD bounced off that moving average, after the price formed a pin candlestick – which is a bullish reversing signal – just above it.
But, the 100 SMA has turned from support into resistance now, keeping the momentum bearish for Ethereum. The price has been hanging around the 20 SMA (gray) for several days now, but buyers are still nowhere to be seen. So, the sentiment remains quite bearish for this digital coin.

Last week’s upside-down hammer candlestick and the rejection by the 20 SMA paint a bearish picture for Ethereum
On the weekly chart, we see that the 20 SMA has turned from support to resistance. Ethereum started to bounce after the first crash, but the second crash came in June and it gave way to sellers, turning into resistance. Last week’s candlestick closed was an upside-down hammer, which is a bearish reversing signal, so the picture is not looking good there either, not to mention the stochastic indicator, which is oversold.

The 50 SMA is keeping the bearish trend constant for the HBAR/USD
However, the situation for Ethereum seems better than it does for Hedera, where the selloff has been constant since the middle of April, while it had already stopped making new highs by the middle of March. The HBAR/USD broke below all the moving averages, which only provided support for a short period.
Now they all seem to have turned into resistance, particularly the 50 SMA (yellow) on the daily chart, which has been pushing it lower in a constant downtrend. So, the bearish momentum prevails here as well, and it will remain so until the moving averages start turning into support.


