Bitcoin Bounces, but it Won’t be Bullish Until it Moves Above $43,000
Bitcoin jumped higher today, but facing further obstacles from $40,000 to $43,000 on the way up
Bitcoin was in the group of cryptos that kept the bullish trend going until the middle of April, while others continued the bullish momentum until mid-May. But it was also among the cryptocurrencies that lost a big chunk of its value. Bitcoin lost more than 50% of its value, as it broke below all moving averages in the first crash.
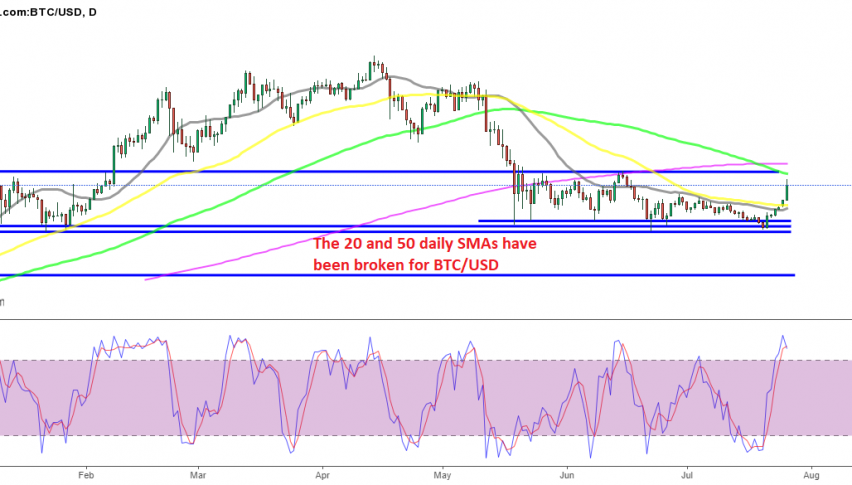
After the first crash in May, which sent Bitcoin down to $30,000, it kept sliding lower, making new lows in July, falling below that big round level. The 20 SMA (gray) kept pushing BTC/USD down, acting as the ultimate resistance indicator from early June. At the beginning of last week, the sellers were pushing the price down, attacking the support level at $30,000, and they succeeded in pushing below it, before it dropped further to under $29,000, but it seems like this support area is holding.
Bitcoin Live Chart
The price reversed and bounced off of this level, as the sentiment suddenly improved in the forex market. After the price stagnated at the 20 SMA for a day, giving the impression that the bearish trend might resume again, buyers had another go and pushed the price well above that moving average, which is now history.
Elon Musk’s comments about Doge coin and his company Tesla acceptance of Bitcoin payments again, had the market moving last week, while Amazon is also looking at accepting Bitcoin by the end of this year. Large investment funds are also incorporating Bitcoin and other cryptocurrencies, so the war on cryptos is not materializing as the establishment might have hoped.

Bitcoin’s support area around $30,000 seems to have survived
This is improving the sentiment in the cryptocurrency market, and today BITCOIN jumped more than $5,000 higher, although buyers couldn’t take the price above $40,000. The resistance zone in which Bitcoin was reversing down in May and June was from $40,000 until $43,000, and the 100 SMA (green) and the 200 SMA (purple) stand around that level on the daily timeframe chart at the moment.
On the weekly chart above, the 50 SMA (yellow) has helped provide support as well, but the resistance area still remains above this, and Bitcoin hasn’t reached $40,000 yet. So, buyers have more work to do, and until they push above $43,000, the bearish trend still remains. Only a push above that area will shift the long-term trend from bearish to bullish.
- Check out our free forex signals
- Follow the top economic events on FX Leaders economic calendar
- Trade better, discover more Forex Trading Strategies
- Open a FREE Trading Account
- Read our latest reviews on: Avatrade, Exness, HFM and XM
Related Articles


Sidebar rates
Related Posts
