Buy the Retrace in Bitcoin on the H4 Chart, or Wait for a Deeper Pullback on the Daily Chart?
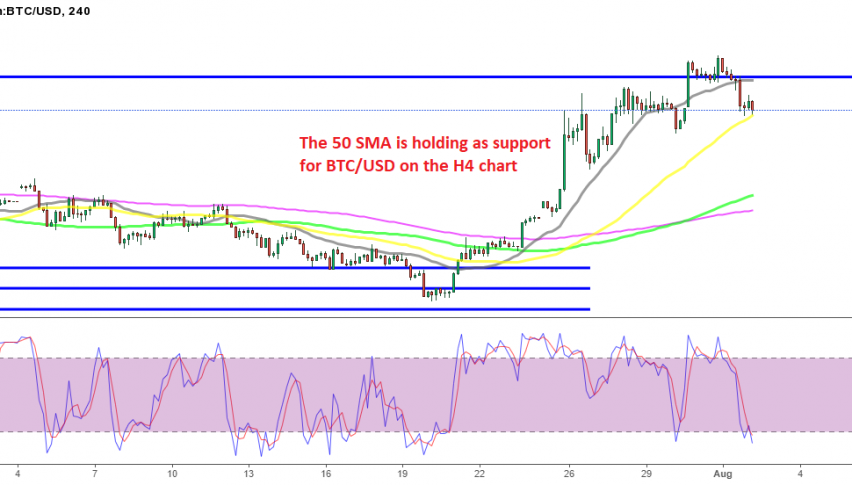
Bitcoin is finding support at the 50 SMA on the H4 chart, but the pullback might continue lower on the daily chart
Cryptocurrencies turned bullish about two weeks ago, after they had been bearish for more than two months and were not showing any signs of reversal. In fact, they were looking increasingly bearish without any bounces, until the reversal came, which sent Bitcoin surging around $13,000 higher in the past two weeks.
We have had quite a few trades in Bitcoin and other cryptocurrencies during this time, as they were pushing higher. Bitcoin buyers pushed above $40,000, but last Friday we saw a pullback down to $38,400, where we decided to buy Bitcoin, since it was finding support at the 100 SMA (green) on the H1 chart. The price bounced off that moving average, pushing over $42,500, which was higher than the highs in May.
Bitcoin Live Chart
We booked profit up there, but we’re seeing another pullback down today, which has taken the price more than $3,000 lower. However, BTC/USD has reached the 50 SMA (yellow) on the H4 chart, where it has stalled in the last several hours. The retrace is complete on this time-frame, with the stochastic indicator being oversold. So, we are thinking about opening another buy signal in Bitcoin, targeting $42,000 and above.
Shifting to the daily chart, we can see on the daily timeframe, that there is more room to retrace down for Bitcoin. BTC/USD reversed down at the 200 SMA (purple) yesterday after stalling below it on Saturday. Looking at the daily chart, we see that there is still a lot of room for BITCOIN to continue the retreat down, either to the 100 SMA (green) or the 50 SMA (yellow).

The 200 daily SMA acting as resistance again for Bitcoin
The 100 daily SMA stands at Friday’s lows of around $38,400, while the 50 daily SMA stands at around $35,000. The 50 SMA would be a great place to buy Bitcoin, since it would turn from a resistance indicator into support. By that time, the stochastic indicator would also be oversold on the daily chart.
But at the moment, it seems like the price has stalled here for Bitcoin, so we are following the price action. If sellers resume control and push below the 50 SMA on the H4 chart at the top, then we will wait for sellers to push to the 50 SMA on the daily chart, at $35,000. If they can’t push below it soon, then we might go long from here, but we are observing the action in this area now. By the way, you can follow our forex signals page for live Bitcoin signals.
- Check out our free forex signals
- Follow the top economic events on FX Leaders economic calendar
- Trade better, discover more Forex Trading Strategies
- Open a FREE Trading Account
- Read our latest reviews on: Avatrade, Exness, HFM and XM
Related Articles


Sidebar rates
Related Posts
