Bitcoin Price Prediction: Can 38.2% Fib Underpin BTC?
Bitcoin accelerated above the $47,000 resistance level against the US dollar, but the gains in BTC were short-lived, and it fell to trade at
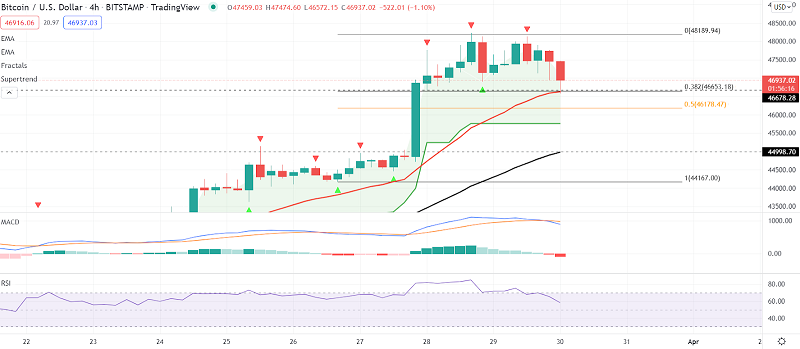
Bitcoin accelerated above the $47,000 resistance level against the US dollar, but the gains in BTC were short-lived, and it fell to trade at the 46,800 level to complete a 38.2% Fibonacci retracement. Overall, BTC/USD shows signs of life and may rally towards the $50,000 resistance level. However, Bitcoin experienced a significant technical breakout above the $45,500 resistance zone.
Currently, the price is trading above $46,500 and the 100 hourly SMA (simple moving average). On the hourly timeframe of the BTC/USD pair, a critical bullish trend line is forming with support near $46,200. The pair may continue to rise and trade near the $50,000 resistance level.
Bitcoin’s price remained above the $45,500 resistance level. BTC began a new uptrend and was able to break through the $46,500 resistance zone. The price decided to settle above the 100 hourly simple moving average and gained momentum above the $46,500 level. Finally, it surpassed the $48,000 mark. A high near $48,200 was formed, and the price is now consolidating gains.
Below $48,000, there was a minor drop. Bitcoin traded below the 23.6 percent Fib retracement level of the upward move from the swing low of $44,470 to the high of $48,200. On the hourly chart of the BTC/USD pair, a critical bullish trend line is forming with support near $46,200.
On the upside, the price is encountering resistance near $48,000. The next major resistance is likely to be found at around $48,200. A successful break and close above $48,200 could push the price up to $49,000. The next significant resistance mark could be around $49,500. Any further gains could pave the way for a move towards the $50,000 mark.
Dips in BTC Are Limited?
If Bitcoin fails to break through the $48,200 resistance mark, it may initiate a downtrend. On the bearish side, there’s immediate support near $47,000. The next major support level is seen near $46,350. It is close to the 50% Fib retracement level of the upward move from the $44,470 swing low to the $48,200 high.
The trend line and the $46,000 level are the main supports. A break below the $46,000 support level could send a price as low as $45,000. Good luck!
- Check out our free forex signals
- Follow the top economic events on FX Leaders economic calendar
- Trade better, discover more Forex Trading Strategies
- Open a FREE Trading Account
- Read our latest reviews on: Avatrade, Exness, HFM and XM
Related Articles


Sidebar rates
Related Posts
