Ethereum Completes 50% Fibonacci Retracement – Quick Technical Outlook
Ethereum has broken through the $1,700 resistance level against the US dollar. ETH has failed to maintain a price over $1,700 and is current
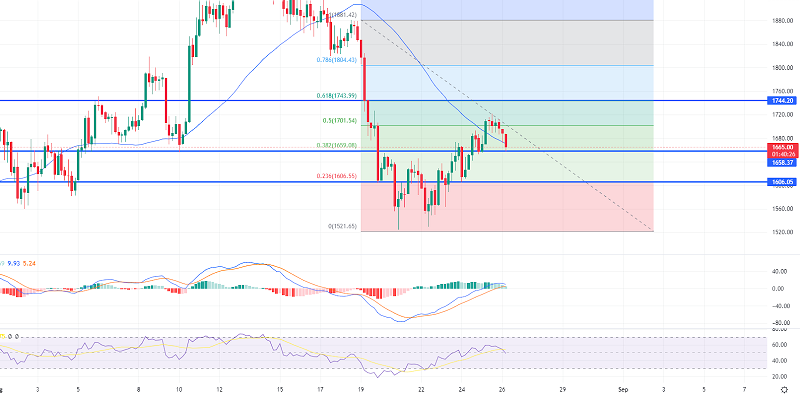
Ethereum has broken through the $1,700 resistance level against the US dollar. ETH has failed to maintain a price over $1,700 and is currently battling to move higher. ETHEREUM was able to rise gradually above $1,650 and $1,700.
The price currently trades over $1,655 and the 100 hourly simple moving average. On the hourly chart of ETH/USD, a critical rising channel is forming with support near $1,670. If the pair remains above the $1,655 support level, it may continue to rise.
Ethereum Price Has Reached a High Near $1,700
Above the $1,650 barrier level, Ethereum began an upward retracement. ETH broke over the $1,660 and $1,675 resistance levels to enter the short-term positive zone. A rise above $1,700 occurred, as did a close above the 100 hourly simple moving average. The price of ether has risen a few points above the 50% Fib retracement level of the crucial slide from the $1,880 swing high to the $1,525 low.
However, the bulls could not maintain their position above the $1,700 resistance level. It is now trading below $1,680. On the hourly chart of ETH/USD, a critical rising channel is forming with support near $1,670.
On the upside, immediate resistance is near $1,700. The first significant barrier is presently emerging near $1,720. The next significant resistance is located near the $1,745 level. It is close to the 61.8% Fib retracement of the crucial slide from the $1,880 swing high to the $1,525 low.
A decisive break above $1,745 might drive the price towards $1,800 resistance. Any further increases may pave the way for the $1,850 resistance challenge.
A New Drop in ETH?
If Ethereum fails to break through the $1,720 resistance, it may begin a new drop. On the downside, initial support is near the $1,670 zone and the channel trend line.
The next significant support is between $1,655 and the 100 hourly simple moving average, below which the price of ether may accelerate lower. In the aforementioned scenario, the price may fall towards $1,600. Any further losses might push the price down to $1,550. Good luck!
- Check out our free forex signals
- Follow the top economic events on FX Leaders economic calendar
- Trade better, discover more Forex Trading Strategies
- Open a FREE Trading Account
- Read our latest reviews on: Avatrade, Exness, HFM and XM
Related Articles


Sidebar rates
Related Posts
