Will NZD/USD Resume Downtrend After the Retrace Up to the 50 Daily SMA?
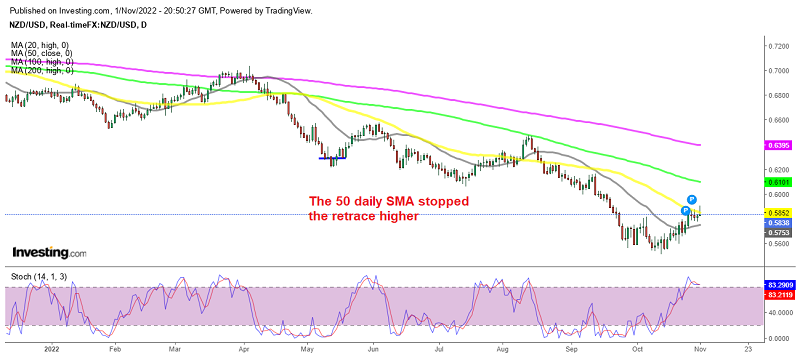
NZD/USD has been on a bearish trend for more than a year on the larger charts, although we have seen a retrace higher in recent weeks, as the USD retreated lower on expectations that the FED will slow down with rate hikes after today’s 75 bps hike. But the New Zealand dollar’s three-week rebound might have come to an end as it tests key resistance ahead of the crucial US Federal Reserve Open Market Committee meeting today.
NZD/USD has increased from around 0.55 to 0.59 but it has reached the 50 SMA (yellow) on the daily chart, where it has stalled for several days. Yesterday buyers pushed the price above the 50 SMA but returned back down so that moving average held as resistance.
Now, this forex pair is overbought on this timeframe chart, as the stochastic indicator shows. The rejection is also signalin a bearish reversal, but we will see what the FED has in store for the USD. The RBNZ is surely seeing a dark picture for the New Zealand economy, so the reversal will probably come soon.
Reserve Bank of New Zealand
- Some households and firms will be challenged by the rising interest rate environment
- Increasing household debt loads will slow down the growth of consumption.
- There are increased downside risks to the global economic outlook
- RBNZ expects new residential construction will slow
- The extent to which economic activity will slow in response to rising rates is uncertain
NZD/USD is barely shifting in response to the pearls of wisdom the RBNZ is dispensing in its November 2022 Financial Stability Report
NZD/USD Live Chart


