Forex Signals Brief May 12: UK GDP and US Consumer Sentiment to Close the Week
Yesterday the GBP turned bearish after the BOE rate hike, while today we have the UK GDP report for Q1 and the US UoM Inflation Expectations

Yesterday’s Market Wrap
Yesterday, all attention was focused on the Bank of England (BOE), and as expected, they raised the bank rate by 25 basis points (bps) to 4.50%from 4.25% previously, without encountering any major issues. However, the decision did include some hawkish elements. The BOE revised its projections on inflation and GDP forecasts, indicating a more optimistic outlook. Additionally, the central bank is no longer anticipating a recession in the UK. These factors contributed to a minor boost in the value of the pound following the announcement.
Earlier, the GBP/USD pair experienced a decline from 1.2620 to 1.2570 due to the strength of the US dollar. However, it has since recovered slightly to 1.2600. Despite some initial resilience in equities, the US dollar remained strong throughout the day, despite the slowdown in the US PPI producer inflation for April. The EUR/USD pair fell from 1.0960 to 1.0920, while the USD/CHF pair rose from 0.8890 to 0.8950 before experiencing a slight retracement. Overall, the broader market remains volatile and uncertain, and the key risk events this week, which were not particularly surprising, are not providing much direction for traders and investors.
Today’s Market Expectations
Today we had the New Zealand Inflation Expectations earlier this morning, indicating a cool-off ahead. Although the most important report is coming from the UK once again, with the Q1 GDP which is expected to remain flat at 0.0%, showing a stagnation for the second quarter in a row, after the same reading in Q4 of last year. The March GDP is expected to show a slight expansion of 0.1% though, which is a positive sign. Later in the afternoon, we have the US prelim UoM Consumer Sentiment and UoM Inflation Expectations which will end the week.
Forex Signals Update
Yesterday the volatility was not too high, but there was enough action in the financial markets to open six trading signals, four of which closed in profit. The NZD/USD buy signal was also looking quite good in the European session, approaching the take profit target, but we saw a reversal in the US session which turned the price bearish and we lost that signal.
The 200 SMA Turns Into Resistance for GOLD
Last week, the price of Gold experienced a significant movement on the H1 chart. Initially, it fell below the $2,000 level but found support at the 200 Simple Moving Average (SMA) represented by the purple line. Buyers entered the market, leading to a bounce in the price of Gold. The positive momentum continued until the release of the US Consumer Price Index (CPI) report yesterday, after which Gold has shown bearish signs and has fallen below the 200 SMA.

XAU/USD – 60 minute chart
NZD/USD Breaks the 20 SMA
The NZD/USD pair has been exhibiting a bullish trend, with various moving averages providing support, including the 50 Simple Moving Average (SMA) depicted by the yellow line on the H1 chart. The bullish momentum has been gaining strength, and recently, we witnessed a significant surge in price. This was influenced by a retreat in the value of the US dollar and an improvement in overall market sentiment. Consequently, the buy signal for NZD/USD reached its take profit target.

USD/JPY – 240 minute chart
Cryptocurrency Update
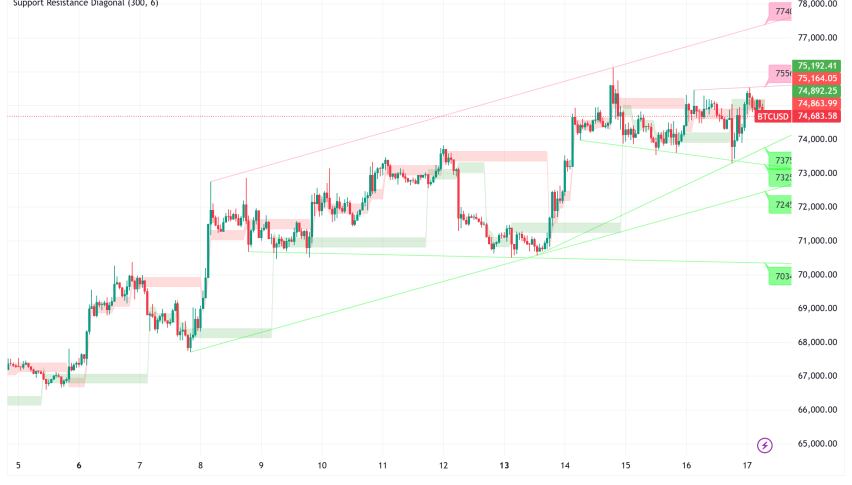
MAs Are Turning Into Resistance for BITCOIN
Bitcoin has shown some weakness since the middle of April, when it made a new high above $31,000, where it stood for just a moment before retreating back below. The 50 SMA (yellow) has been acting as support on the daily chart, pushing the lows higher, but the highs were getting lower as well and this week we saw a break of that moving average which opened the door for a deeper retreat. Now this moving average has turned into resistance.

BTC/USD – Daily chart
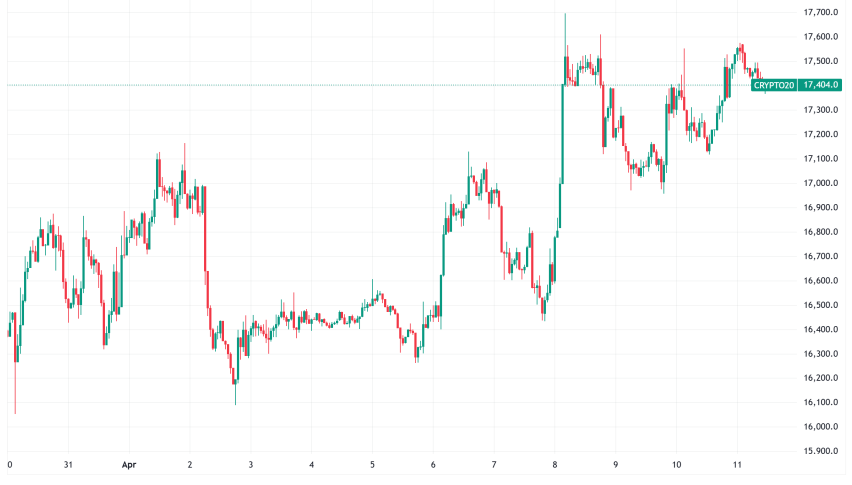
ETHEREUM Slipping Below $1,800
The buying pressure has slowed in recent weeks and we have seen a retreat in Ethereum in the last several days. But, the correction looks almost complete as the 50 SMA (yellow) holds as support while the stochastic indicator is oversold already. So, we decided to open a buy ETH signal a while ago.

ETH/USD – Daily chart
- Check out our free forex signals
- Follow the top economic events on FX Leaders economic calendar
- Trade better, discover more Forex Trading Strategies
- Open a FREE Trading Account
- Read our latest reviews on: Avatrade, Exness, HFM and XM
Related Articles

Sidebar rates
Related Posts
