EUR/USD Traders observe primary obstacle at 1.1250
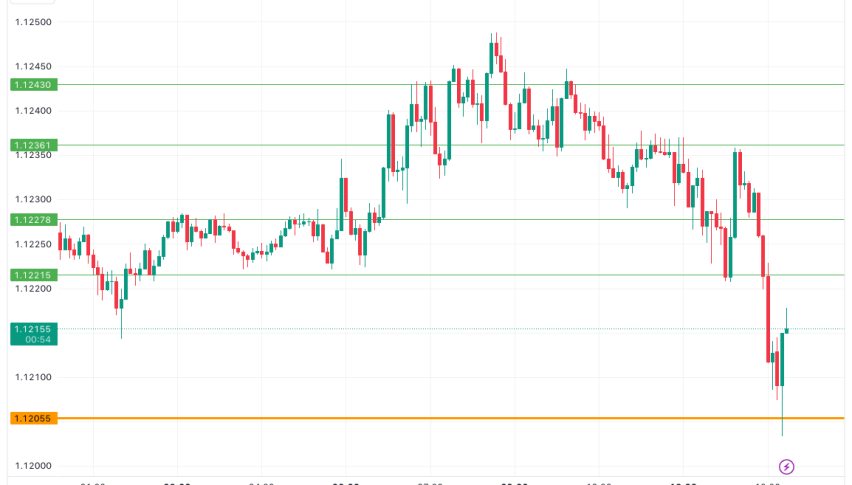
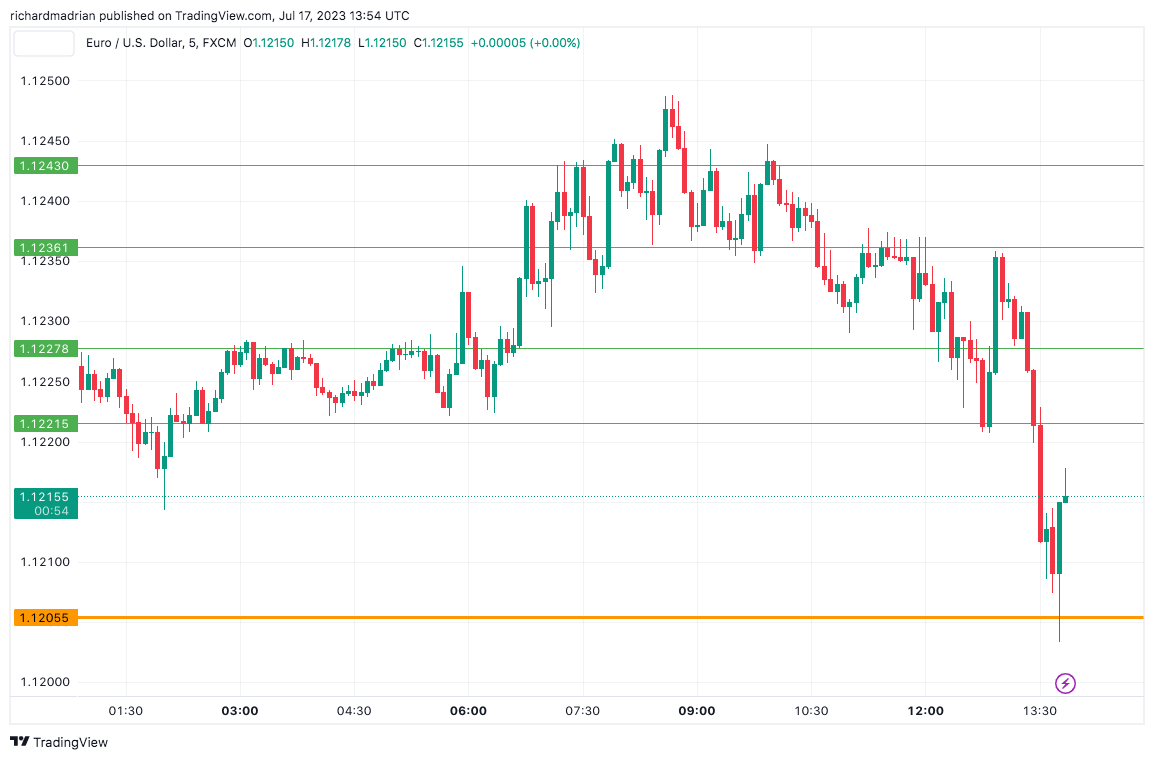
On Monday, the EUR/USD faced mounting pressure, leading to a test of the 1.1200 regions. Despite this temporary setback, the overall momentum appears to favour an upward trajectory shortly. However, it is worth noting that the pair’s current state of being overbought could potentially trigger a sudden corrective knee-jerk reaction.
Looking ahead, should the EUR/USD surpass the peak achieved in 2023 at 1.1248 on July 17, it is anticipated to encounter a notable resistance level at the 2022 high of 1.1495, which was recorded on February 10. This level represents a significant hurdle that the pair must overcome to continue its upward movement.
Taking a broader perspective, when analyzing the long-term outlook, the positive sentiment remains intact, provided that the EUR/USD remains above the 200-day Simple Moving Average (SMA). Currently positioned at 1.0658, the 200-day SMA acts as a key support level. As long as the pair remains above this level, the overall outlook remains optimistic, suggesting the potential for further gains in the future.
Despite the short-term pressure and possible corrective reaction due to overbought conditions, the EUR/USD favours an upward momentum. Breaking the 2023 peak opens up the path towards a significant resistance level at the 2022 high. From a long-term perspective, as long as the pair remains above the 200-day SMA, the positive outlook remains consistent.
EUR/USD technical analysis indicators
In the current technical analysis of EUR/USD, the pair faces an initial hurdle at the 1.1250 level. Examining the indicators, there are 7 sell signals, 4 neutral signals, and 14 buy signals, indicating a mixed sentiment among market participants. The oscillators provide further insight, with 6 sell signals, 3 neutral signals, and 2 buy signals, reflecting a slightly bearish bias.
When considering the moving averages, there is 1 sell signal, 1 neutral signal, and 12 buy signals. This suggests a predominantly bullish stance, indicating that the pair’s upward momentum may persist. However, it is essential to note that market conditions can change rapidly.
The Relative Strength Index (RSI) stands at 72, indicating that the pair is currently in overbought territory. This suggests a potential for a corrective pullback or consolidation in the near term.
Examining the MACD (Moving Average Convergence Divergence) level, it is at 0.0082, indicating a buy signal. This suggests that the buying pressure may be increasing, potentially supporting further upward movement in the pair.
In summary, while the initial hurdle for EUR/USD lies at 1.1250, the overall technical analysis reveals mixed signals. The indicators and oscillators portray varying sentiments, with a slightly bearish tilt. However, the moving averages suggest a predominantly bullish bias. It is important to monitor the RSI level. This is because it indicates overbought conditions. While the MACD level supports a potential continuation of the upward momentum.
- Check out our free forex signals
- Follow the top economic events on FX Leaders economic calendar
- Trade better, discover more Forex Trading Strategies
- Open a FREE Trading Account
- Read our latest reviews on: Avatrade, Exness, HFM and XM
Related Articles


Sidebar rates
Related Posts
