S&P500, NASDAQ and DJIA Price Forecast: Will the Bullish Momentum Continue?
S&P500 (SPX): Will The Price Continue Its Uptrend?
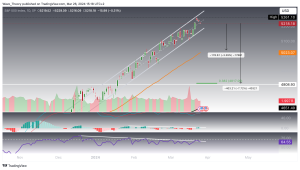
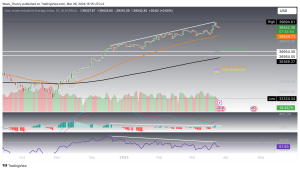
The S&P 500 continues its ascent within the parallel channel, encountering rejection at the channel’s upper resistance recently. This rejection suggests a potential retracement towards the channel’s support. Should this support falter, a correction of approximately 3.4% to the 50-day EMA could follow. A breach of this level could see the SPX decline further to a critical Fibonacci level at 4,817, marking a potential total downside of 7.72%. The evolving bearish divergence in the RSI and MACD histogram underscores the likelihood of a correction in the short to medium term.
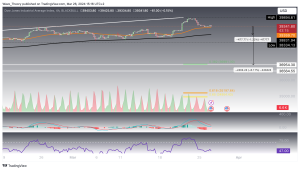
On the 4-hour chart, bearish divergences reinforce expectations of a downward adjustment, with immediate support located around 1.81% below the current price at the 50-4H EMA.
Nasdaq Composite Index (IXIC): Is There Further Upside?
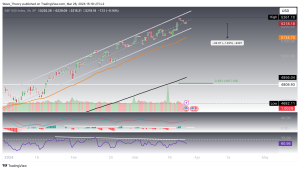
The Nasdaq Composite(IXIC) maintains its trajectory within an upward channel, though significant bearish divergences in the daily RSI and MACD histogram signal potential for a pullback.
Immediate supports are identified at the 50-day EMA (15,779) and the 200-day EMA (14,447), suggesting downside risks of approximately 3.7% to 12%. Despite these bearish indicators, the bullish crossover of the EMAs and MACD lines affirms the prevailing upward trend.
Before any corrective action towards these EMAs, the IXIC is supported at the channel’s lower edge and further bolstered by the 50-4H EMA at 16,090. The presence of bearish divergence in the 4-hour RSI and MACD, alongside bullish MACD lines and a golden EMA crossover, suggests a bullish outlook in the short term, albeit with caution for a potential correction.
DJIA (US30): Is A Major Correction Move Around The Corner?
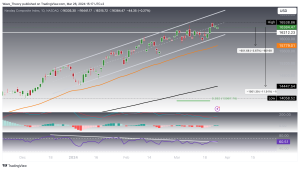
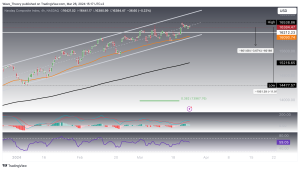
The Dow Jones Industrial Average exhibits a bearish divergence in the daily RSI and MACD histogram, hinting at an impending correction. Yet, the trend remains bullish, as indicated by the golden EMA crossover and bullish MACD lines.
Should a correction occur, significant support is found at the 50-day EMA (38,554). Failure to hold this level exposes the index to further downside towards the 0.382 Fibonacci level at 36,991.
In the interim, the US30 is supported by the 50-4H EMA (39,269) and the 200-4H EMA (38,832). A breakdown below these levels could precipitate a move to the 0.382 Fibonacci support, implying a potential decline of around 6%.
- Check out our free forex signals
- Follow the top economic events on FX Leaders economic calendar
- Trade better, discover more Forex Trading Strategies
- Open a FREE Trading Account
- Read our latest reviews on: Avatrade, Exness, HFM and XM
Related Articles
Sidebar rates
