XRP Price Prediction: Ripple’s Coin Struggles at $0.526 Amid SEC Lawsuit and Market Pressure
Ripple's XRP coin has struggled to halt its previous bearish trend, remaining under pressure around the $0.5287 level and hitting an intrada
Ripple’s XRP coin has struggled to halt its previous bearish trend, remaining under pressure around the $0.5287 level and hitting an intraday low of $0.5243.
The cryptocurrency has experienced an 18% decline from its peak of $0.6431 on April 9th to May 23rd. However, the decline could be attributed to the uncertainty surrounding Ripple facing SEC lawsuit challenges. The ongoing legal battle and regulatory uncertainty are exerting downward pressure on XRP’s price.
Furthermore, the bearish sentiment in the crypto market, driven by the cautious approach of the US Fed to maintain its restrictive policy for longer, is seen as another key factor putting pressure on the XRP coin price.
Ripple’s Response to Legal Uncertainties: International Expansion and Investor Vigilance
Ripple investors are closely monitoring the impact of legislative changes like the FIT21 Act and the ongoing SEC lawsuit on XRP’s price and institutional sales. Attorney Bill Morgan underscores the need to prepare for potential worst-case scenarios, such as a ban on XRP sales in the US. Despite these risks, Ripple remains resolute in its commitment to continue operations, intending to sell XRP to international clients through compliant entities.
This proactive stance aligns with Ripple’s strategy of obtaining licenses in various countries to sustain its global business. XRP faces downward pressure due to legal uncertainties, but it also shows signs of consolidation and positive technical indicators.
Therefore, the ongoing SEC lawsuit and regulatory uncertainties are affecting XRP’s price, currently at $0.52. Despite legal risks, signs of consolidation and positive technical indicators offer some resilience. Investors should stay vigilant.
XRP Price Forecast: Technical Outlook
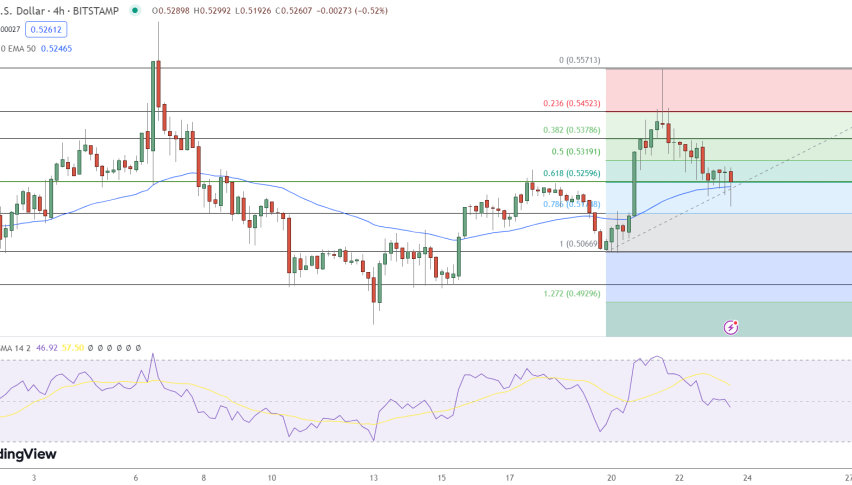
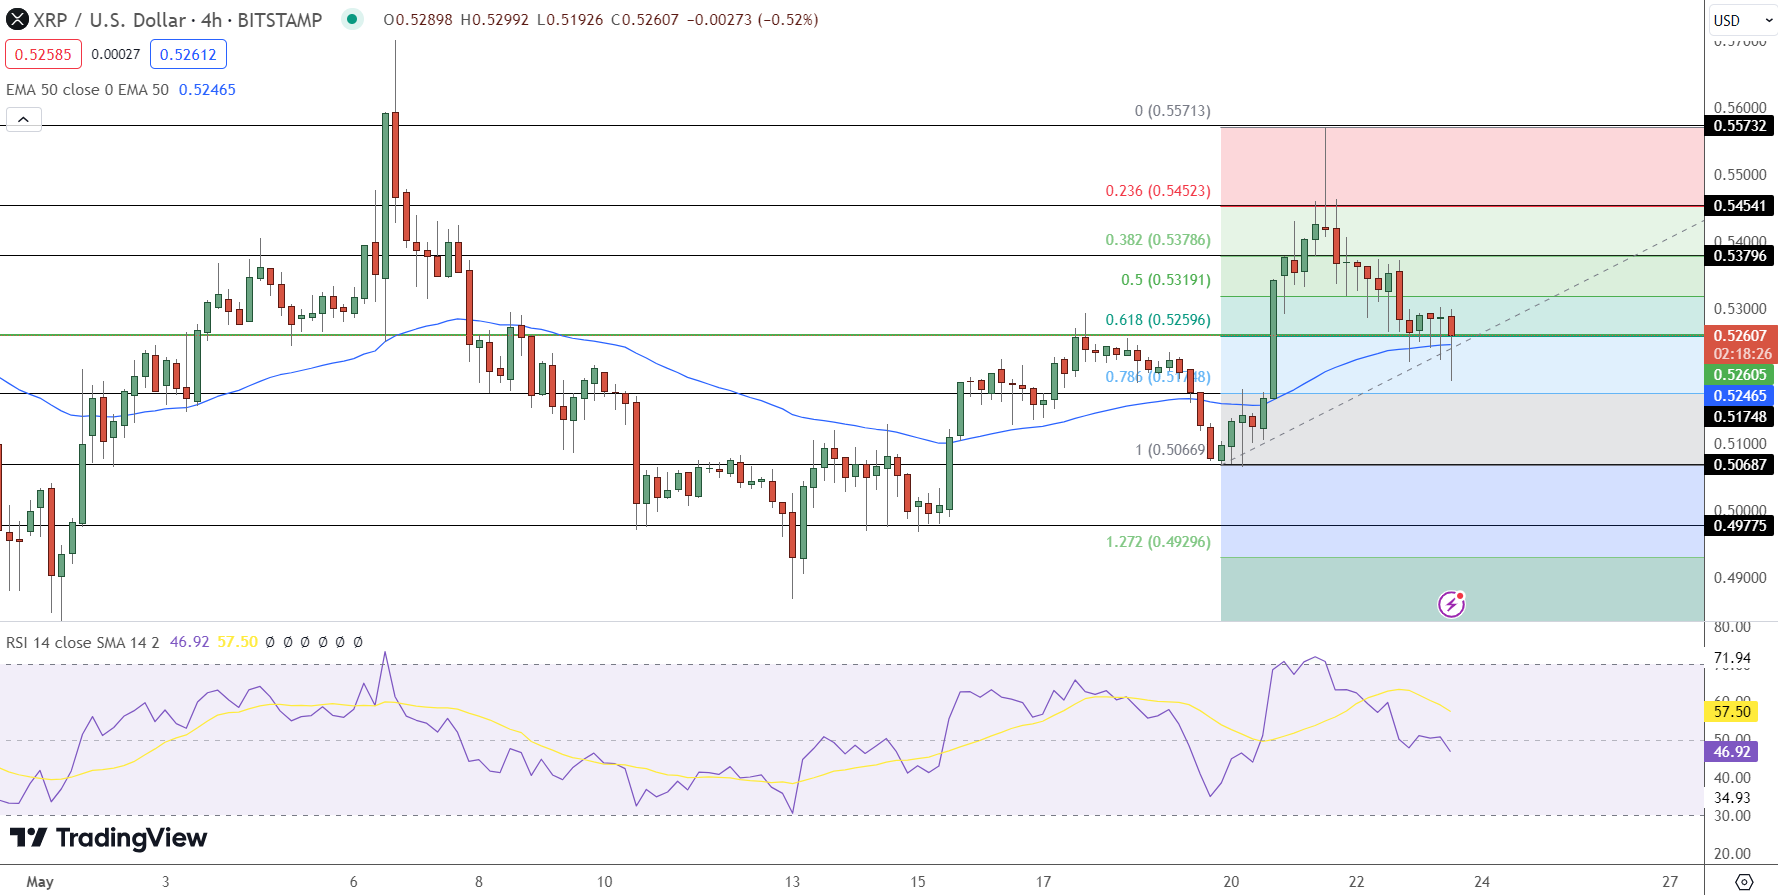
XRP is currently trading at $0.52607, down 0.52% in the last 24 hours. The pivot point, marked by the green line at $0.52596, serves as a crucial level for determining the trend direction.
Immediate resistance levels to watch are $0.53796, $0.54541, and $0.55732. These levels could pose barriers to upward movement, with selling pressure likely to increase as prices approach these points.
On the downside, support levels are identified at $0.52465, $0.51748, and $0.50687, providing potential entry points for buyers if the price declines.
The Relative Strength Index (RSI) is at 46.92, indicating neutral market conditions. The 50-day Exponential Moving Average (EMA) stands at $0.52465, providing a support level close to the pivot point.
In conclusion, XRP’s price action suggests a neutral to bullish outlook as long as it remains above the pivot point. However, breaking below this level could lead to further downside pressure.
- Check out our free forex signals
- Follow the top economic events on FX Leaders economic calendar
- Trade better, discover more Forex Trading Strategies
- Open a FREE Trading Account
- Read our latest reviews on: Avatrade, Exness, HFM and XM
Related Articles

Sidebar rates
Related Posts
