Gold Prices Near 3-Month Highs Amid U.S. Policy Uncertainty – Key Levels to Watch
Gold prices surged to near three-month highs on Friday, driven by ongoing uncertainty surrounding U.S. President Donald Trump's

Gold prices surged to near three-month highs on Friday, driven by ongoing uncertainty surrounding U.S. President Donald Trump’s trade policies.

The precious metal is poised for a fourth consecutive weekly gain as the U.S. dollar faces its worst weekly decline in two months. The dollar index (DXY) fell over 1% this week, making gold more attractive to foreign investors.
“The dollar slipped after Trump refrained from implementing aggressive tariffs post-inauguration, which went against market expectations,” said Jigar Trivedi, senior analyst at Reliance Securities.
Trump’s recent call for an immediate interest rate cut and the absence of clear direction on trade policies have further fueled market uncertainty, leading investors to seek refuge in safe-haven assets like gold. The lack of policy clarity has pushed traders toward gold, driving its demand higher amid market volatility.
Upcoming central bank meetings, including the Bank of Japan’s expected rate decision on Friday and the Federal Reserve and ECB’s meetings next week, could influence gold’s short-term trajectory.
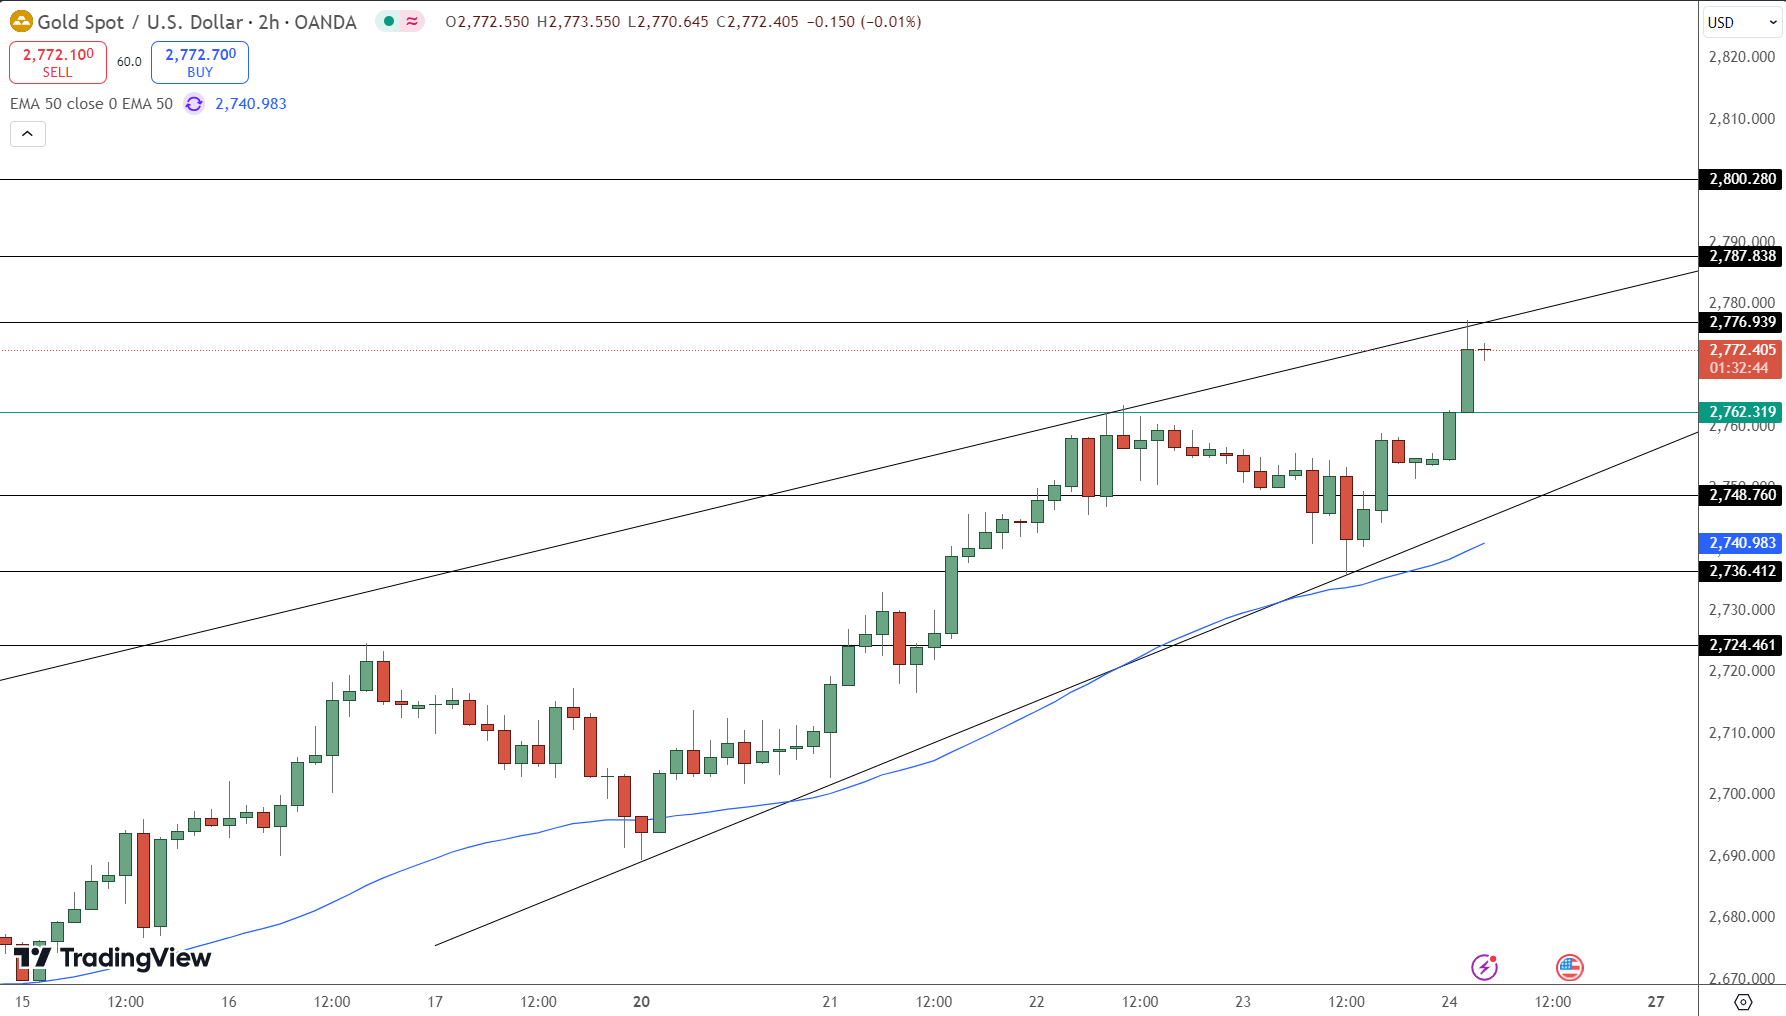
Key Technical Levels to Watch
Gold’s current trading price of $2,772.40 suggests strong bullish momentum within an ascending channel. The bullish engulfing candle pattern observed in recent sessions signals further potential upside above the $2,765 pivot level.
Key resistance levels:
-
Immediate resistance at $2,776.93, which, if breached, could drive prices to the next level at $2,787.83, followed by the psychological barrier at $2,800.28.
Key support levels:
-
Immediate support stands at $2,748.76, with further downside at the 50-day EMA of $2,740.98, a crucial zone for maintaining the current uptrend.
The 50-day EMA is reinforcing the bullish outlook, while a break below it could shift momentum toward the next major support at $2,724.46.
Market Outlook Amid Economic Uncertainty
Investors remain focused on the upcoming central bank decisions, with the Fed’s policy stance being a key factor in gold’s performance. Market participants see little chance of a Fed rate hike, which historically supports non-yielding assets like gold.
Traders are also eyeing Trump’s next policy moves, particularly on trade tariffs and economic stimulus measures, which could further impact the dollar and, in turn, gold prices.
Analysts suggest that gold could test new all-time highs in the coming weeks if uncertainty persists. “There is a possibility of gold hitting record levels soon, and the outlook remains positive,” said Trivedi.
Key Takeaways:
-
Gold’s bullish trend is reinforced by a strong technical structure, with a key pivot at $2,765.
-
Resistance at $2,776.93, with further upside potential toward $2,800, if market momentum sustains.
-
A break below $2,740.98 (50 EMA) could trigger corrective selling pressure.
As uncertainty looms over U.S. policy direction, gold remains a preferred hedge for investors seeking stability in turbulent markets.
- Check out our free forex signals
- Follow the top economic events on FX Leaders economic calendar
- Trade better, discover more Forex Trading Strategies
- Open a FREE Trading Account
- Read our latest reviews on: Avatrade, Exness, HFM and XM
Related Articles


Sidebar rates
Related Posts
