Forex Signals Brief Feb 5: Stocks, Crypto, Commodities Awaiting the Trump-China Call
Today we have the US Services PMI, but markets will trade the outcome of the Trump-Xi call, which will decide how the tariff war will procee

Today we have the US Services PMI, but markets will trade the outcome of the Trump-Xi call, which will decide how the tariff war will proceed.
Although Tuesday’s news flow was much lighter than the previous day, market trends continued in a familiar direction. Equities started the session flat but gradually climbed higher, aided by an intraday decline in Treasury yields. The 10-year yield fell from around 4.60% to 4.50%, which put pressure on the US dollar, leading to persistent selling as sentiment improved, particularly in the latter half of European trading. By midday in the US, the momentum began to stabilize.
Notable market moves included a sharp 100-pip drop in USD/CAD to the 1.4320s, bringing the pair back to levels seen last month. Meanwhile, the euro erased Monday’s tariff-driven gap, rising about 50 pips in US trading to reach 1.0385. A weaker-than-expected JOLTS report indicated softer wage pressures, which could give the Federal Reserve more flexibility to cut rates if the economy weakens. Reports of a potential Trump-Xi phone call following the exchange of tariffs between the US and China added to market optimism. China’s response was milder than expected, which supported Chinese stocks, however we will see how the phone call goes today.
While the call never materialized and the reason remains unclear, markets anticipate it will be rescheduled. Elsewhere, oil prices fell to $70 lows and bounced nearly $3 to reach $73 amid competing narratives—hopes for peace in Ukraine contrasted with renewed concerns over potential tariffs on Iran. Any resolution involving Russia is likely to include demands for lifting oil-related sanctions, adding another layer of uncertainty to global energy markets.
Today’s Market Expectations
Today we have several data releases, however the news on the Trump-China call will be driving markets around, so we will keep an eye there. Japan’s average cash earnings are projected to rise 3.8% year-over-year, up from the previous 3.0%. This follows the Bank of Japan’s recent 25 basis point rate hike, justified by evidence of accelerating wage growth. Looking ahead, there is little forward guidance beyond the usual statement that rate hikes will depend on economic and inflation trends. However, if earnings data continues to strengthen, markets may start pricing in another rate increase by year-end. Unlike last year, when shifting interest rate expectations caused significant volatility, the focus now is on the extent of inflation easing.
In the US, ADP employment data is expected to show 150K new jobs, up from 122K previously. While ADP is not a reliable predictor of nonfarm payrolls, it signals a stable but moderating pace of job creation. The ISM Services PMI is forecast at 54.2, slightly above the prior 54.1, whereas the S&P Global Services PMI recently missed expectations. However, the agency noted that sustained business confidence could mean the slowdown is temporary, even as output growth softened in January. Employment growth remains at levels unseen in over two years, driven by an improved economic climate. Still, Manufacturing PMI provides a clearer picture of business cycle shifts.
The sentiment remained positive again yesterday after the freezing of tariffs on Mexico and Canada yesterday, and they saw strong buying momentum, leading to a volatile but ultimately weaker U.S. dollar. Across 26 forex trades, we secured 19 wins and 7 losses, maintaining a predominantly long stance on equities and gold.
Gold Continues to March Toward $3,000
Gold surged to a new all-time high of $2,798.40 today, maintaining strength above the previous peak of $2,790. The bullish momentum remains intact, with a potential push beyond $2,800 and even toward $3,000 as buyers continue to dominate. Global economic and political uncertainty continues to bolster gold’s appeal as a safe-haven asset. The latest US GDP report added further support to XAU/USD, propelling it past the late October high of $2,790. However, volatility was notable, with gold briefly dipping to $2,772 before rebounding sharply to $2,830, while yesterday the upside continued, with XAU almost hitting $2,850.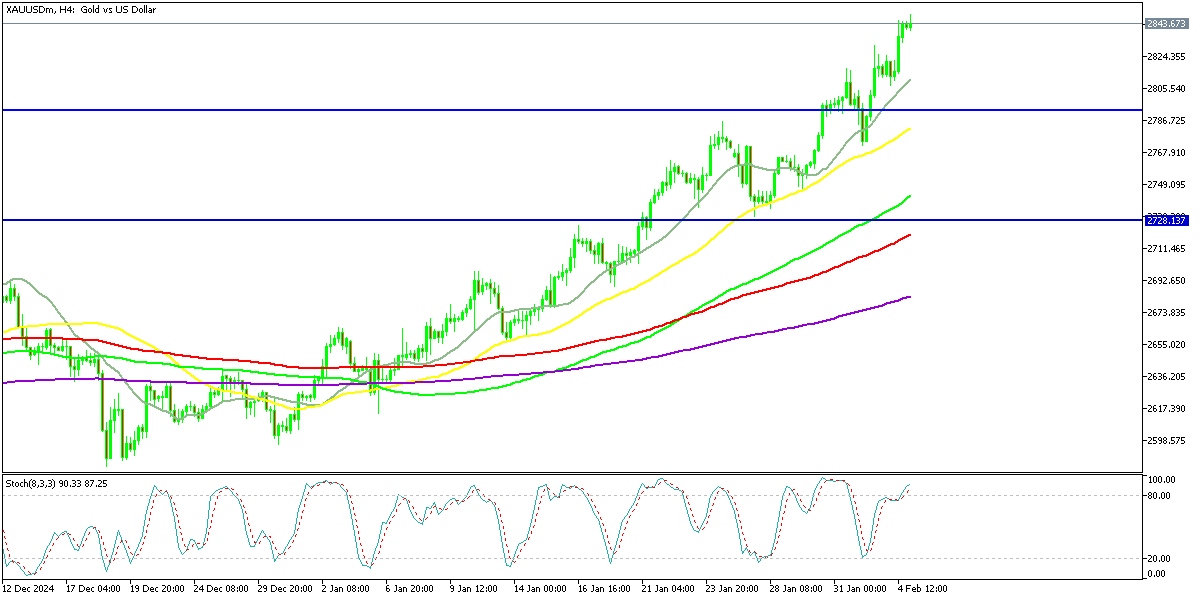
XAU/USD – H4 Chart
USD/CAD Falls Below the 50 SMA
The USD/CAD pair opened with a two-cent bullish gap after the weekend’s tariff news but quickly retraced as the tariffs were suspended. This led to sharp fluctuations following the Trump-Trudeau call, where USD/CAD initially spiked to a 20-year high of 1.4793 before settling at 1.44. Trump later described the discussion as “very well,” which strengthened the Canadian dollar and contributed to a two-cent drop in USD/CAD.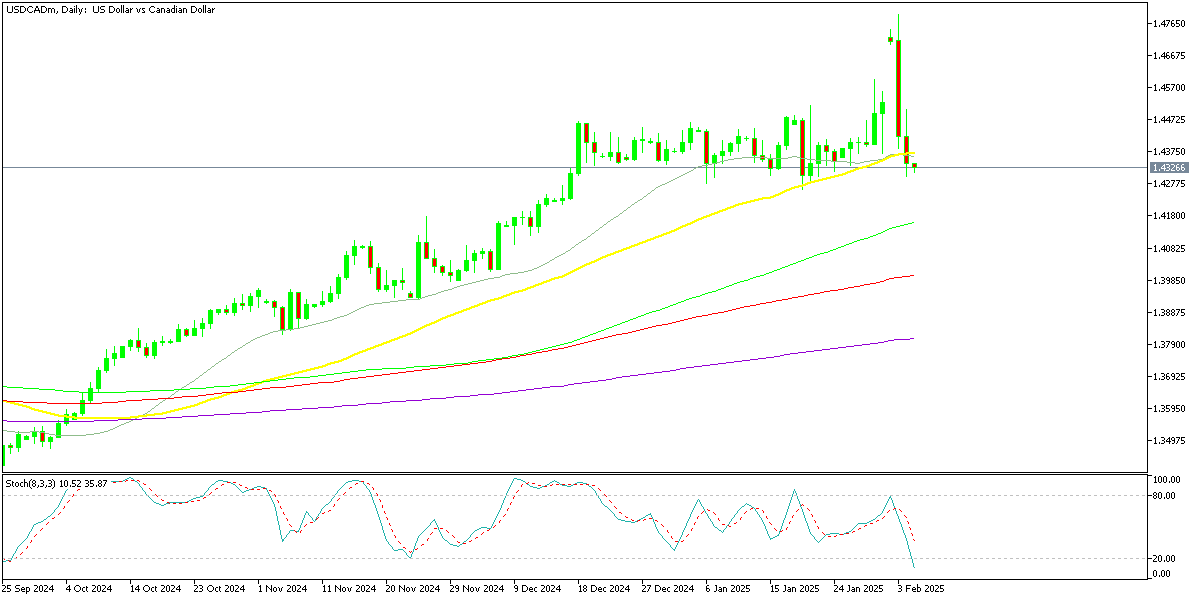
USD/CAD – Daily Chart
Cryptocurrency Update
Bitcoin Returns Below $100K
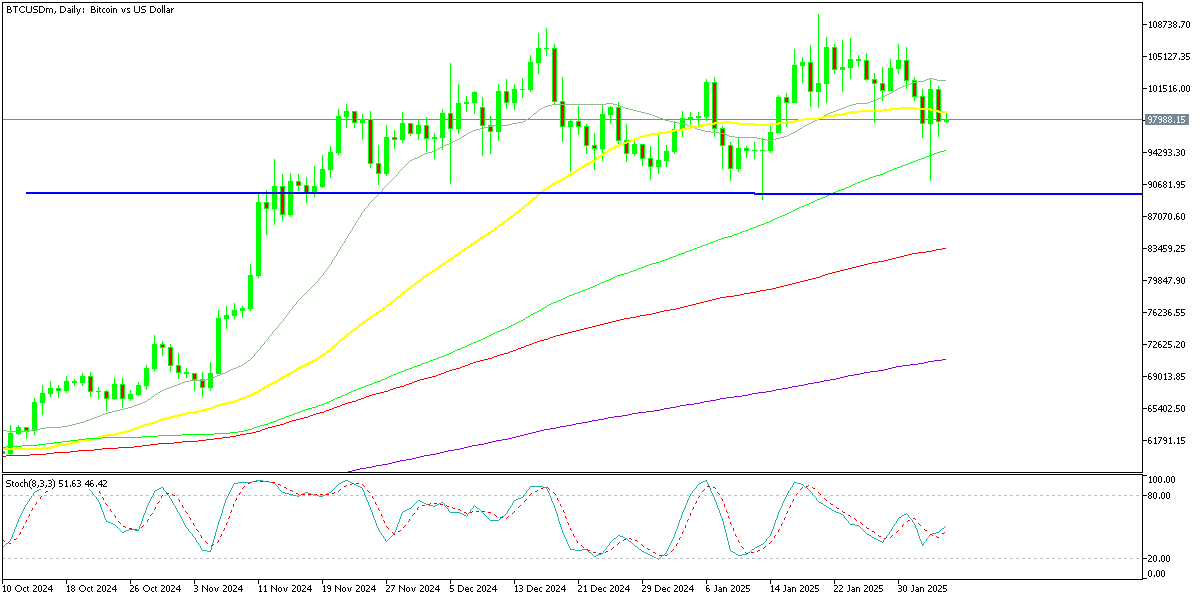
BTC/USD – Daily chart
Ethereum Falls Below $3,000
Ethereum mirrored Bitcoin’s volatility but experienced even sharper fluctuations. ETH/USD slipped close to $2,000 to test key support around $2,100 before rebounding. The price action formed a pin candlestick, signaling potential bullish momentum, and ETH managed to recover toward $2,900, indicating a significant bounce. However, like in BTC, Ethereum declined yesterday.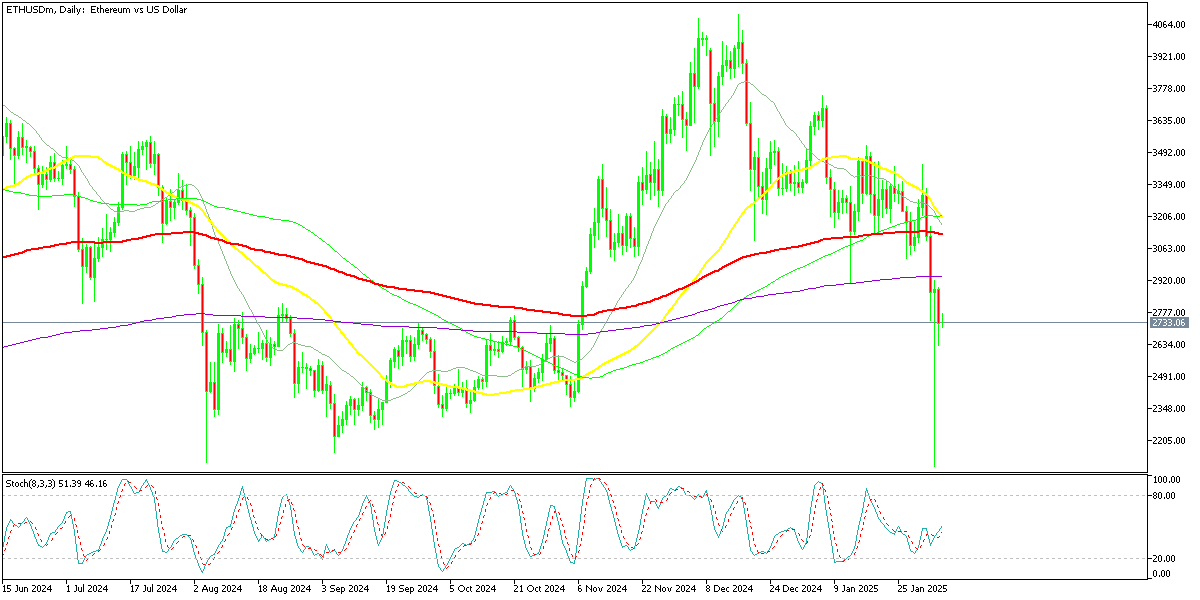
ETH/USD – Daily Chart
- Check out our free forex signals
- Follow the top economic events on FX Leaders economic calendar
- Trade better, discover more Forex Trading Strategies
- Open a FREE Trading Account
- Read our latest reviews on: Avatrade, Exness, HFM and XM
Related Articles


Sidebar rates
Related Posts
