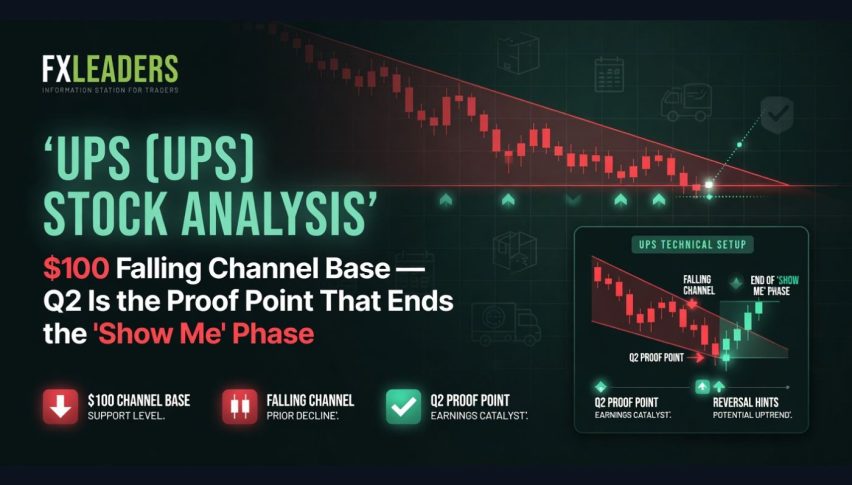
UPS (UPS) Stock Analysis: $100 Falling Channel Base — Q2 Is the Proof Point That Ends the “Show Me” Phase
On May 8, UPS traded at $100.62, staying within a downward trend since the April high of $109.86. Q1 FY2026 results slightly beat...
Quick overview
- UPS stock is currently trading at $100.62, down 20% this year and 50% below its 2022 peak.
- Q1 FY2026 results showed a slight revenue beat but a 27% drop in net income, attributed to one-time costs and declining volume.
- CEO Carol Tomé anticipates a turnaround in the second half of 2026, with Q2 earnings on July 28 being a critical test for this claim.
- Technical analysis indicates potential resistance at $101.26 and support levels between $99.24 and $97.74, with a bullish signal emerging from recent price action.
On May 8, UPS traded at $100.62, staying within a downward trend since the April high of $109.86. Q1 FY2026 results slightly beat expectations but showed the turnaround remains expensive. Revenue per piece is up, but volume is down, and net income fell 27%. The stock has dropped 20% this year and is 50% below its 2022 peak. CEO Carol Tomé points to the second half of 2026 as a turning point. Wall Street will judge this claim after Q2 earnings on July 28.
What Q1 Actually Showed — Beyond the Headline Beat
Q1 revenue reached $21.2 billion, slightly above the $21.0 billion consensus. Adjusted EPS was $1.07, beating the $1.02 estimate by 4.9%. However, the details are more important than the headline numbers. US domestic revenue dropped 2.3% due to lower volume, but revenue per piece rose 6.5%. International revenue per piece increased by 10.7%. This shift matches the turnaround plan: focusing on fewer, more profitable shipments instead of relying on high-volume, low-margin business from Amazon.
UPS faced about $150 million in one-time transitional costs in Q1, including the Driver Choice Program buyout, which was oversubscribed as UPS aimed to cut 7,500 drivers. The CFO said these costs will start to go away in Q2. UPS also achieved $600 million in network efficiency savings in Q1, moving toward a $3 billion full-year goal. If this pace continues and one-time costs disappear, Q2 margins should improve even if revenue stays flat.
UPS kept its full-year 2026 guidance at $89.7 billion in revenue and a 9.6% non-GAAP adjusted operating margin. Still, the stock dropped 4% on earnings day because, as Motley Fool put it, Wall Street is in a “show me” mood after several years of missed targets.
Fuel costs remain a real risk and are closely tied to the oil market trends discussed in this series. The CEO highlighted higher fuel prices and weaker US consumer confidence as the main risks for demand in the second half of the year. With WTI oil still above $90 even after the MOU selloff, UPS’s operating costs stay high. Every $10 per barrel change in crude oil adds about $200 to $300 million in annual fuel expenses for UPS.
UPS Technical Analysis: Falling Channel Support, RSI Divergence Signal
On the 4-hour chart, UPS is forming a bullish hammer at the lower edge of a downward channel that started from the April high of $109.86. Immediate resistance is at the 0.382 Fibonacci level of $101.26, while the 0.236 Fibonacci at $99.22 acts as near-term support.
Key resistance levels are $102.90 (0.5 Fibonacci and red moving average), $104.57 (0.618 Fibonacci), and $109.86 (top of the channel). Support is found between $99.24 and $97.74 (confluence zone), with further support at $95.94 (0.0 Fibonacci base).
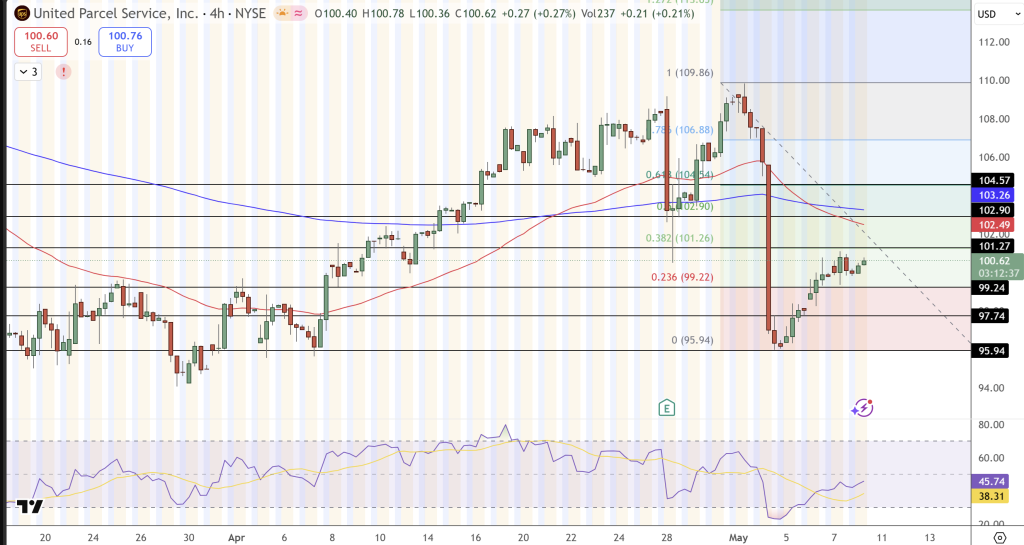
The RSI between 38 and 45 shows positive divergence at the May swing low, which is a technical sign that selling may be ending at the channel base. Recent higher volume on green candles also points to a possible reversal, but the overall downtrend remains until UPS moves above $104.57.
Trade idea: Go long if UPS rises above $101.50, with a target range of $104.57 to $106.88, and a stop loss below $99.24.
FAQ: UPS — Turnaround Thesis, Fuel Cost Risk, and the July 28 Inflection Test
Why did UPS stock fall 4% after beating earnings estimates?
Net income dropped 27% year-over-year to $864 million, even though EPS beat estimates. This was due to $150 million in one-time costs and ongoing volume declines. The market now wants proof of margin recovery, not just earnings beats. With an adjusted operating margin of 4.0% compared to the 9.6% full-year target, the gap is hard to overlook. Q2 earnings on July 28 will be the first real test of management’s claim that things will turn around in the second half.
How does the oil price environment affect UPS specifically?
Fuel is one of UPS’s biggest operating costs. The CEO pointed out that high fuel prices and weaker consumer confidence are the main risks for demand in the second half of the year. With WTI oil at $94, still high even after dropping from over $102, UPS’s margin recovery depends partly on the outcome of Iran peace talks. If the Strait of Hormuz reopens and WTI drops to $83–$88, as Goldman expects for Q4, UPS could see $200–$400 million less in annual fuel expenses.
What is the UPS price target and when does the turnaround become visible?
TIKR analysis sees a path to $141 for UPS if the turnaround is fully successful, with revenue per piece returning to normal, $3 billion in efficiency savings, and growth in healthcare and international segments making up for lower domestic volume. The stock is now 50% below its 2022 high of $230. In the short term, the technical target is $104.57 to $106.88 if the price breaks out of the channel. The Q2 2026 earnings report on July 28 will show whether management’s second-half turnaround story holds up.
- Check out our free forex signals
- Follow the top economic events on FX Leaders economic calendar
- Trade better, discover more Forex Trading Strategies
- Open a FREE Trading Account
- Read our latest reviews on: Avatrade, Exness, HFM and XM
Related Articles
Sidebar rates
