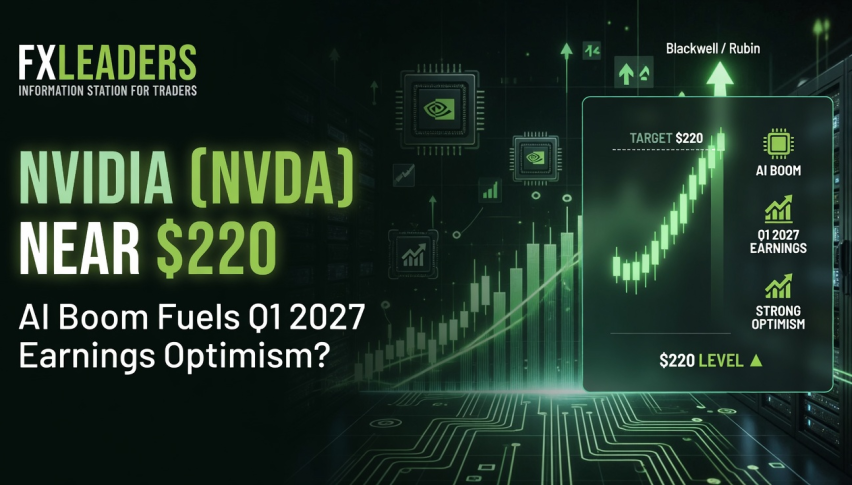
NVIDIA (NVDA) Near $220: AI Boom Fuels Q1 2027 Earnings Optimism?
Nvidia company’s stock has been showing slightly poor performance over the past five days, but before that, it had been performing...
Quick overview
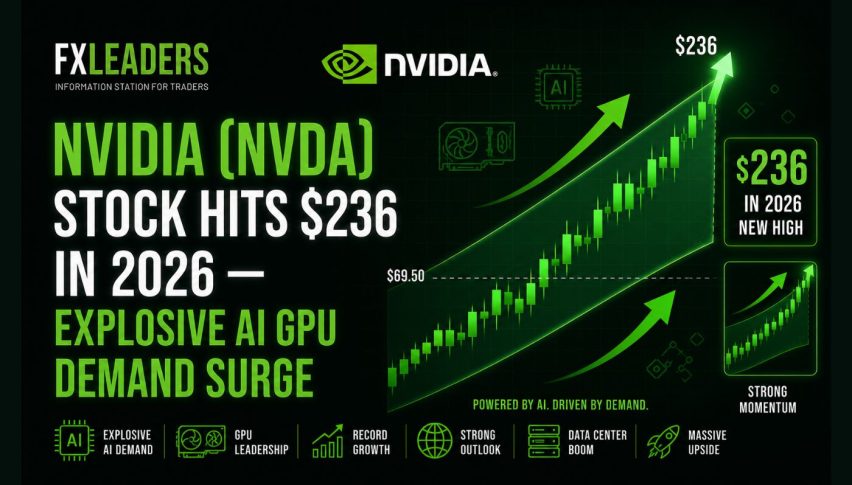
- Nvidia's stock has experienced a slight decline recently, trading at $220.61 with a loss of 0.77%.
- The company is set to release its Q1 2027 earnings report today, with analysts expecting sales between $78 to $79 billion, an 80% increase from last year.
- Nvidia's previous fiscal year saw record sales of $215.9 billion, primarily driven by its data center business for AI technology.
- Analysts maintain a positive outlook on Nvidia's stock, with price targets ranging from $270 to $380.
Nvidia company’s stock has been showing slightly poor performance over the past five days, but before that, it had been performing exceptionally well for several months, and at the time we are writing this article, it is trading at $220.61 and showing a loss of 0.77 percent.
Today is a very important day for this company’s stock because Nvidia is going to release its latest earnings report for the first quarter of the 2027 fiscal year, which is why investors are eagerly waiting for this report and want to see how much money the company has earned in its Q1 2027, and based on that, they will form an opinion about the company’s future performance.
Wall Street analysts are expecting that this company will show sales of $78 to $79 billion in its report, which is considered 80% higher than the same quarter last year. Analysts are also expecting that its earnings per share will be from $1.77 to $1.78, which is being shown as double compared to last year.
Considering their performance in the past several quarters and the expectations for this quarter’s report, it is evident that the future of this company is very bright, and because of this the investors of this company who have bought its stocks appear to be very satisfied.
Nvidia Company Introduction
If we talk about this company, it is a very large technology company that makes very powerful computer chips, which are used for artificial intelligence. The demand for their chips is currently very high in the market because the demand for AI is increasing a lot in the market. All the big companies like Google and Microsoft are buying these chips to make big AI systems that can think, learn, and do smart tasks.
Nvidia Sales and Growth Summary
Now, if we talk about the previous fiscal year 2026, Nvidia made a record total sale of $215.9 billion, which was seen as 65% higher compared to the previous year, and about 90% of their total earnings came from their data center business, where they produce chips for AI technology. For example, in their last quarter of 2026, they earned $62.3 billion only from the data center business, so from this you can yourself estimate how much demand there is for their AI products in the market.
Considering the company’s outstanding performance and its very high sales, many analysts have very positive views about this company’s stock and they give it a buy rating. Many analysts have set its price target from $270 to $380, which is considered very high. In addition, banks have also increased their forecast regarding this company’s stocks and their data center business. They believe that in the future their data center business will grow further.
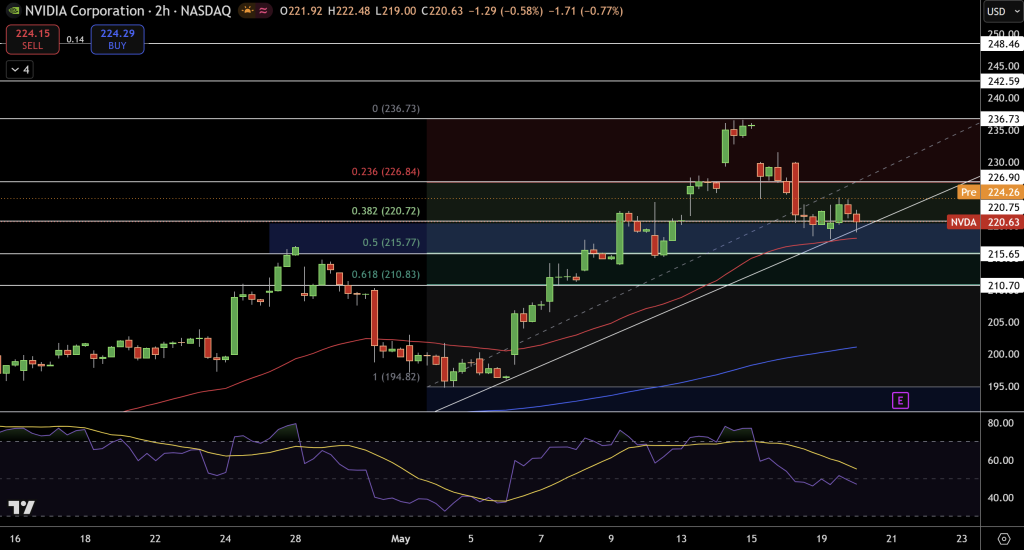
NVIDIA Technical Analysis
NVIDIA is currently trading at $220.63, marking a drop of $1.29 or -0.58% on the 2-hour NASDAQ chart. The recent red candles represent a well-formed pullback following an impulsive wave that pushed up to the top of the channel at $236.73. Currently, NVDA is successfully defending the 0.382 Fibonacci extension at $220.72, along with the middle of the channel. The price is sitting on top of the red moving average line support at the $215-$218 zone while the blue MA line at $201-$210.
The market trend is very bullish with higher highs and higher lows intact in the rising channel that originated from the $194.82 bottom. We don’t see any bearish engulfing or bearish triangle breakdown. The previous impulsive candle broke out from the 0.618 Fibonacci at $210.83 and the 1.0 extension as well, which is now correcting in this flag formation.
The oscillator indicator on the bottom (similar to RSI) has cooled down to a level around 48-56, which is a neutral zone. The RSI is showing positive divergences in the pullback phase of the price action. So this is a sign of a strong bounce from any bearish pressure before reaching the oversold level. Key resistance is near $224.26-$226.84 followed by $231-$236.73. Immediate support is at $220.72-$215.65.
Trade Idea
Go Long above $222.50, target $226.84 and $231.00, stop below $219.80.
- Check out our free forex signals
- Follow the top economic events on FX Leaders economic calendar
- Trade better, discover more Forex Trading Strategies
- Open a FREE Trading Account
- Read our latest reviews on: Avatrade, Exness, HFM and XM
Related Articles
Sidebar rates
Related Posts
