GS Stock Breaks Above $1,100 as AI Dealmaking Boom Fuels Record Goldman Sachs Earnings
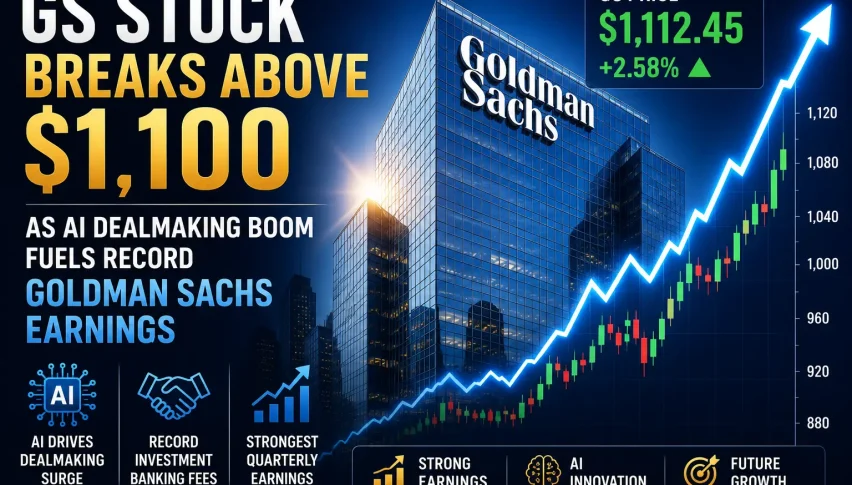
Goldman Sachs GS stock jumps 9% after record Q2 revenue as AI-fueled trading, IPOs and dealmaking push shares to new highs.
Quick overview
- Goldman Sachs shares surged 9% to $1,140 after reporting record quarterly earnings of $20.98 per share, significantly exceeding expectations.
- The investment bank's revenue rose 39.5% to $20.34 billion, driven by strong performance in AI-driven trading and investment banking fees.
- Goldman's Asset & Wealth Management division also saw a 20% revenue increase, contributing to a more stable revenue base.
- Despite the strong performance, risks remain as investors may become selective after the stock's sharp rise and potential macroeconomic challenges.
Goldman Sachs shares surged to new highs after record quarterly revenue, as AI-driven trading, IPO activity and investment banking fees lifted earnings far above expectations.
Goldman Sachs Surges as AI Boom Reaches Wall Street
Goldman Sachs delivered one of the strongest bank earnings reports of the season, confirming that the AI boom is now benefiting Wall Street as well as chipmakers and cloud companies.
The investment bank reported earnings of $20.98 per share, crushing expectations around $14.51. Revenue surged 39.5% to $20.34 billion, far ahead of forecasts near $16.46 billion.
The results marked Goldman’s strongest growth since 2021 and showed that capital markets activity is recovering faster than expected.
Shares responded sharply, rising 9% to $1,140 and touching fresh 52-week highs. The move pushed GS firmly above recent resistance and made the stock one of the strongest large-cap financial names in Tuesday’s session.
AI Capex Super Cycle Boosts Trading and Banking
The main driver behind Goldman’s outperformance was the broadening AI investment cycle.
CEO David Solomon described the current environment as an AI capital expenditure super cycle, with financing demand spreading across regions, industries and asset classes. That is a powerful setup for Goldman because the firm earns fees from advising on deals, underwriting equity and debt issuance, financing infrastructure, and supporting trading activity.
Goldman’s Global Banking & Markets revenue rose 53% to $15.52 billion. Investment banking fees climbed 55% to $3.395 billion, while equities underwriting revenue surged 130% and debt underwriting increased 75%.
Equities trading was even stronger, jumping 72% to $7.416 billion as clients traded around AI-linked capital flows, index rebalancing, Asian semiconductor exposure and major market transactions.
SpaceX and Alphabet Deals Highlight AI-Linked Fee Boom
Goldman’s role in major transactions helped reinforce the market’s confidence.
The firm worked on several high-profile deals tied to the AI and infrastructure cycle, including the SpaceX IPO and Alphabet’s large equity offering. These transactions show how AI spending is moving beyond chip companies and into data centers, power infrastructure, financing markets and strategic M&A.
Goldman also claimed leading positions in announced and completed M&A, equity-related offerings and leveraged lending.
This matters because Goldman is one of the purest public-market plays on a revival in investment banking and trading. When deal activity accelerates, GS often benefits more directly than universal banks with larger consumer lending exposure.
Asset and Wealth Management Adds Stability
Goldman’s Asset & Wealth Management division also contributed to the strong quarter.
Revenue in the segment increased 20% to $4.597 billion, while assets under supervision rose by $391 billion to a record $4.04 trillion.
That growth gives Goldman a more durable revenue base alongside its trading and advisory businesses. Investors have long wanted the firm to reduce reliance on volatile capital markets revenue, and stronger asset management growth helps support that strategy.
However, the current rally is still primarily being driven by capital markets momentum. If IPOs, equity issuance and M&A remain strong, Goldman’s earnings power could stay elevated through the second half of 2026.
Risks Remain After Powerful Rally in GS Stock
Despite the strong quarter, investors may become more selective after such a sharp move.
Goldman is already up more than 20% year to date and now trades at new highs. That leaves less room for disappointment if deal pipelines slow, volatility fades, or macro conditions weaken.
Solomon also warned that trade policy shifts and market volatility remain risks to future activity. The AI infrastructure cycle is still in its early stages, but investor expectations have now risen significantly.
The key question is whether Goldman can sustain this level of earnings momentum or whether Q2 represents a peak quarter boosted by unusually strong trading and transaction volume.
GS Technical Analysis: Breakout Clears $1,100
GS closed at $1,140 on July 14, before edging slightly higher to $1,141.58 in after-hours trading.
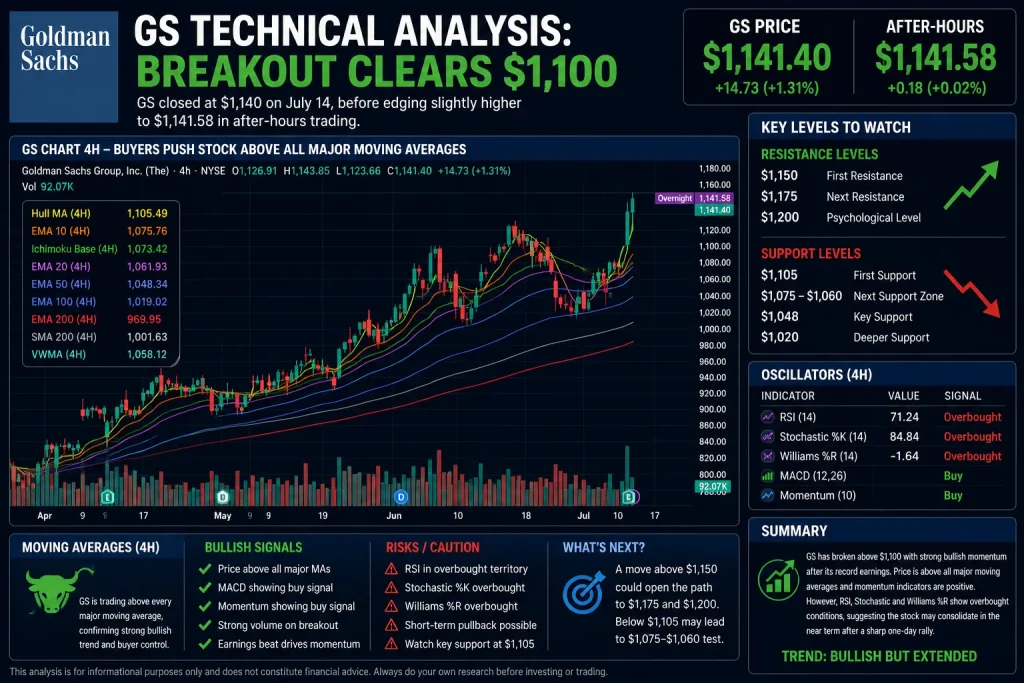
GS Chart 4H – Buyers Push Stock Above All Major Moving Averages
The 4-hour chart remains strongly bullish. Goldman is trading above every major moving average listed, confirming that buyers remain in control after the earnings breakout.
The first support zone now sits near the Hull Moving Average at $1,105.49, followed by the 10-period EMA at $1,075.76 and the Ichimoku base line near $1,073.42. These levels mark the first area where buyers may look to defend the breakout.
Below that, the 20-period EMA near $1,061.93 and the 50-period EMA near $1,048.34 form the next support band. A deeper pullback toward $1,020 would still leave the broader uptrend intact, as the 100-period EMA sits near $1,019.02.
Momentum indicators remain positive. MACD and Momentum are both flashing buy signals, while all major moving averages are also on buy.
However, RSI at 71.24 shows the stock has entered overbought territory. Stochastic %K at 84.84 and Williams %R near -1.64 also suggest short-term buying pressure is stretched.
Key Levels to Watch
The first upside level is $1,150. A clean move above that area could open the door toward $1,175 and then the psychologically important $1,200 level.
On the downside, $1,105 is the first support level to watch. If GS falls below that area, traders may look for a retest of $1,075-$1,060.
A break below $1,048 would weaken the short-term breakout and suggest that investors are taking profits after the earnings surge.
For now, the technical setup remains bullish, but the stock may need consolidation after such a sharp one-day rally.
AI Has Become a Banking Catalyst for Goldman Sachs
Goldman Sachs has shown that the AI boom is no longer only a semiconductor or cloud story.
The buildout of AI infrastructure is creating demand for financing, advisory services, equity offerings, debt issuance, trading and global capital flows. That is exactly the kind of environment where Goldman’s franchise can outperform.
The Q2 results gave investors strong evidence that capital markets are reopening and that Goldman is positioned near the center of the activity.
Still, after a 9% rally and a move into overbought technical territory, the stock may be vulnerable to short-term profit-taking. Holding above $1,105 would keep the breakout structure intact, while a move above $1,150 could extend momentum toward $1,200.
- Check out our free forex signals
- Follow the top economic events on FX Leaders economic calendar
- Trade better, discover more Forex Trading Strategies
- Open a FREE Trading Account
- Read our latest reviews on: Avatrade, Exness, HFM and XM

Related Articles
Sidebar rates

Related Posts
 Save
Save