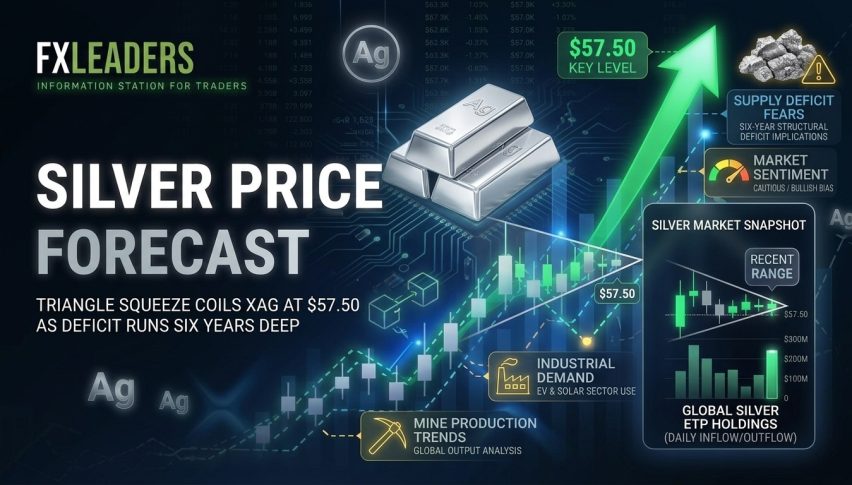
Silver Price Forecast: Triangle Squeeze Coils XAG at $57.50 as Deficit Runs Six Years Deep
On July 14, 2026, the price of silver sits at $57.56, compressed within a symmetrical triangle that is closing towards the top...
Quick overview
- As of July 14, 2026, silver is priced at $57.56, forming a symmetrical triangle that could break out either bullishly above $61 or bearishly below $55.71.
- The Silver Institute reports a supply deficit of 46.3 million ounces for the sixth consecutive year, indicating a slower supply increase due to silver being a byproduct of other mining.
- Industrial demand for silver, driven by sectors like solar energy and electric vehicles, constitutes over half of its consumption, but is tempered by high interest rates and a strong dollar.
- Technical analysis suggests a potential breakout from the triangle pattern, with traders advised to monitor Federal Reserve policies and economic data for price direction.
On July 14, 2026, the price of silver sits at $57.56, compressed within a symmetrical triangle that is closing towards the top. Even though we’re experiencing another supply deficit for silver, that’s the sixth in a row, higher dollar prices are weighing the short term tape. The triangle should resolve to either side: a breakout above resistance at $61 would be bullish and lower support at $55.71 would be bearish and target the middle of the $50s.
A Sixth Straight Year of Deficit
According to the Silver Institute, the metal is facing a shortfall of around 46.3 million ounces in 2026 for the 6th year in a row. It takes time for more silver to be added into the market, because much silver is a byproduct of other mining, for example copper, lead, zinc, etc., and it is slower to increase in supply than it is to decrease. So while we might see a negative headline in the news today from macro pressures, the medium term is bullish for the metal from a fundamental standpoint.
Industrial Demand Does the Heavy Lifting
Silver demand in 2026 comes primarily from industrial uses with that accounting for more than half of the consumption. Silver demand for solar PV, electric vehicles, electronics, 5G, and energy intensive AI data center expansion continues to grow. Industrial uses for silver are tied to things like the energy transition and technological development and this tends to be a stronger source of demand than the speculative demand that we see from investors.
However, this industrial demand is countered by the macro pressures of a high interest rate environment, and the fact that the Federal Reserve may keep rates high for longer to deal with persistent inflation which is strengthening the dollar and putting a cap on silver.
The US-Iran interim agreement may ease geopolitical tensions and energy price volatility which could support industrial demand at the same time it may dampen the safe haven demand for silver. We will have to watch interest rate policy in the US and other central banks, and US economic data to see how these factors affect the price in the near term.
Silver 2H Technical Analysis: Triangle at the Apex
Silver has formed a symmetrical triangle (A-B-C-D) pattern on the 2-hour chart. In the short term, the price is reacting to the descending trendline at the bottom of the pattern. It appears that buyers are absorbing the downside pressure, but as we are still within the descending channel pattern, there is still downside potential to the pattern. The red candles are exhibiting long lower wicks, indicating buyer support at the confluence zone.
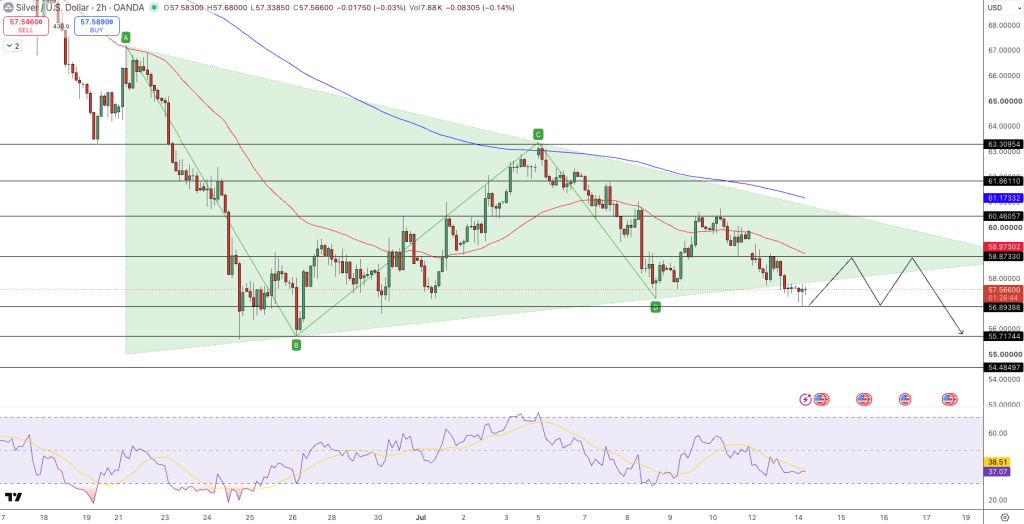
The relative strength index, with a value of 38.51, shows a positive divergence between price and RSI. The divergence indicates a potential reversal on the lower timeframe. It is worth observing that volume tends to decrease near the apex of the triangle. Typically, this occurs prior to a significant price move. The triangle’s base projects a measured move of roughly $4 to $5.
Silver Price Forecast and Key Levels
The triangle pattern suggests the price will breakout at some point. A breakout above the trendline will target $61.17 and $63.31. Alternatively, a downside break of the ascending trendline at $55.71 can lead to a retest of $54.48.
Trade setup: A short at $57.56 below a break of the ascending trendline at $55.71 with a stop-loss above $58.97 and a target at $54.48 to follow the downside break of the triangle. Additionally, while the price trades below the descending channel resistance trendline, short setups may work.
This chart presents an interesting situation. While bullish factors are present in the fundamentals, this particular timeframe appears bearish. It remains to be seen whether the deficits and increased industrial demand will push the price higher or the dollar will fall. If the dollar remains relatively unchanged until the triangle pattern completes, the price could easily range-bound. Traders should track Fed cues and industrial data for the trigger.
- Check out our free forex signals
- Follow the top economic events on FX Leaders economic calendar
- Trade better, discover more Forex Trading Strategies
- Open a FREE Trading Account
- Read our latest reviews on: Avatrade, Exness, HFM and XM

Related Articles


Sidebar rates

Related Posts
 Save
Save