S&P 500 Price Forecast: Surges to Record High on Oracle’s Rally and CPI Data
Global market sentiment has been on an upward trend and remained strong on the day, as evidenced by the bullish performance of the S&P 500
The bullish performance of the S&P 500, a significant stock market index in the United States, which hit a record high on Wednesday, is proof that market sentiment has been on an upward trend and has remained strong throughout the day.
However, the reason for its upward trend can be attributed to the strong performance of tech giant Oracle, whose shares skyrocketed by 11.7% after reporting impressive quarterly results. Furthermore, the announcement of a joint venture with Nvidia, a leading artificial intelligence chip company, further boosted investor confidence.
Another factor fueling the market’s optimism was the release of consumer price data, which showed a 0.4% increase in the Consumer Price Index (CPI) for February.
While this figure was higher than expected, investors were not overly concerned as they interpreted it as a sign that the Federal Reserve might consider cutting interest rates in the future. This expectation of future rate cuts helped lift the stock market to new heights.
Furthermore, the SOX index, which represents the semiconductor industry, saw a 2.1% increase, ending a two-day losing streak. Nvidia, a prominent player in this sector, saw its shares rise by 7.2%, contributing to the overall positive sentiment in the market.
Impact of Inflation Data on S&P 500
Global market sentiment was relatively dampened by the hotter-than-expected inflation data for February. The core CPI, which excludes volatile food and energy prices, rose by 0.4%, surpassing expectations of a 0.3% increase.
The annual core CPI also exceeded expectations, rising by 3.8%. This unexpected uptick in inflation raised concerns among investors, who were hoping for more moderate price increases.
Despite this, the overall market sentiment remained relatively positive, with many investors still optimistic about the economy’s growth prospects.
The Federal Reserve’s upcoming monetary policy decisions will be closely watched, as they navigate the delicate balance between supporting economic recovery and managing inflationary pressures.
This higher-than-expected inflation data raised concerns among investors about the Federal Reserve’s stance on interest rates. The Fed has been signalling that it would consider rate cuts only if it is confident that inflation would return to its 2% target.
The latest inflation figures cast doubt on the possibility of rate cuts in the near term, leading some investors to reassess their expectations.
As a result, according to the CME Fedwatch tool, the likelihood of a rate cut at the Fed’s June policy meeting decreased to 65% from above 72% before the release of the inflation data. This shift in expectations contributed to a slight pullback in the stock market following its record-high close.
Looking ahead, investors will closely watch the upcoming US Producer Price Index (PPI) and retail sales data for February, which are expected to provide further insights into inflation and consumer spending.
The PPI data will indicate the pace of price changes at the factory gate, while the retail sales data will show the strength of household spending, both of which are crucial factors for the stock market’s performance in the coming months.
S&P500 Price Forecast: Technical Outlook
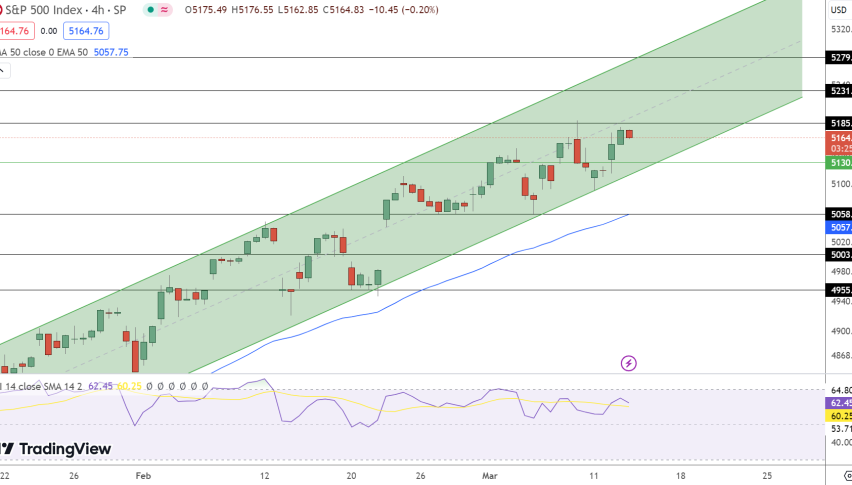
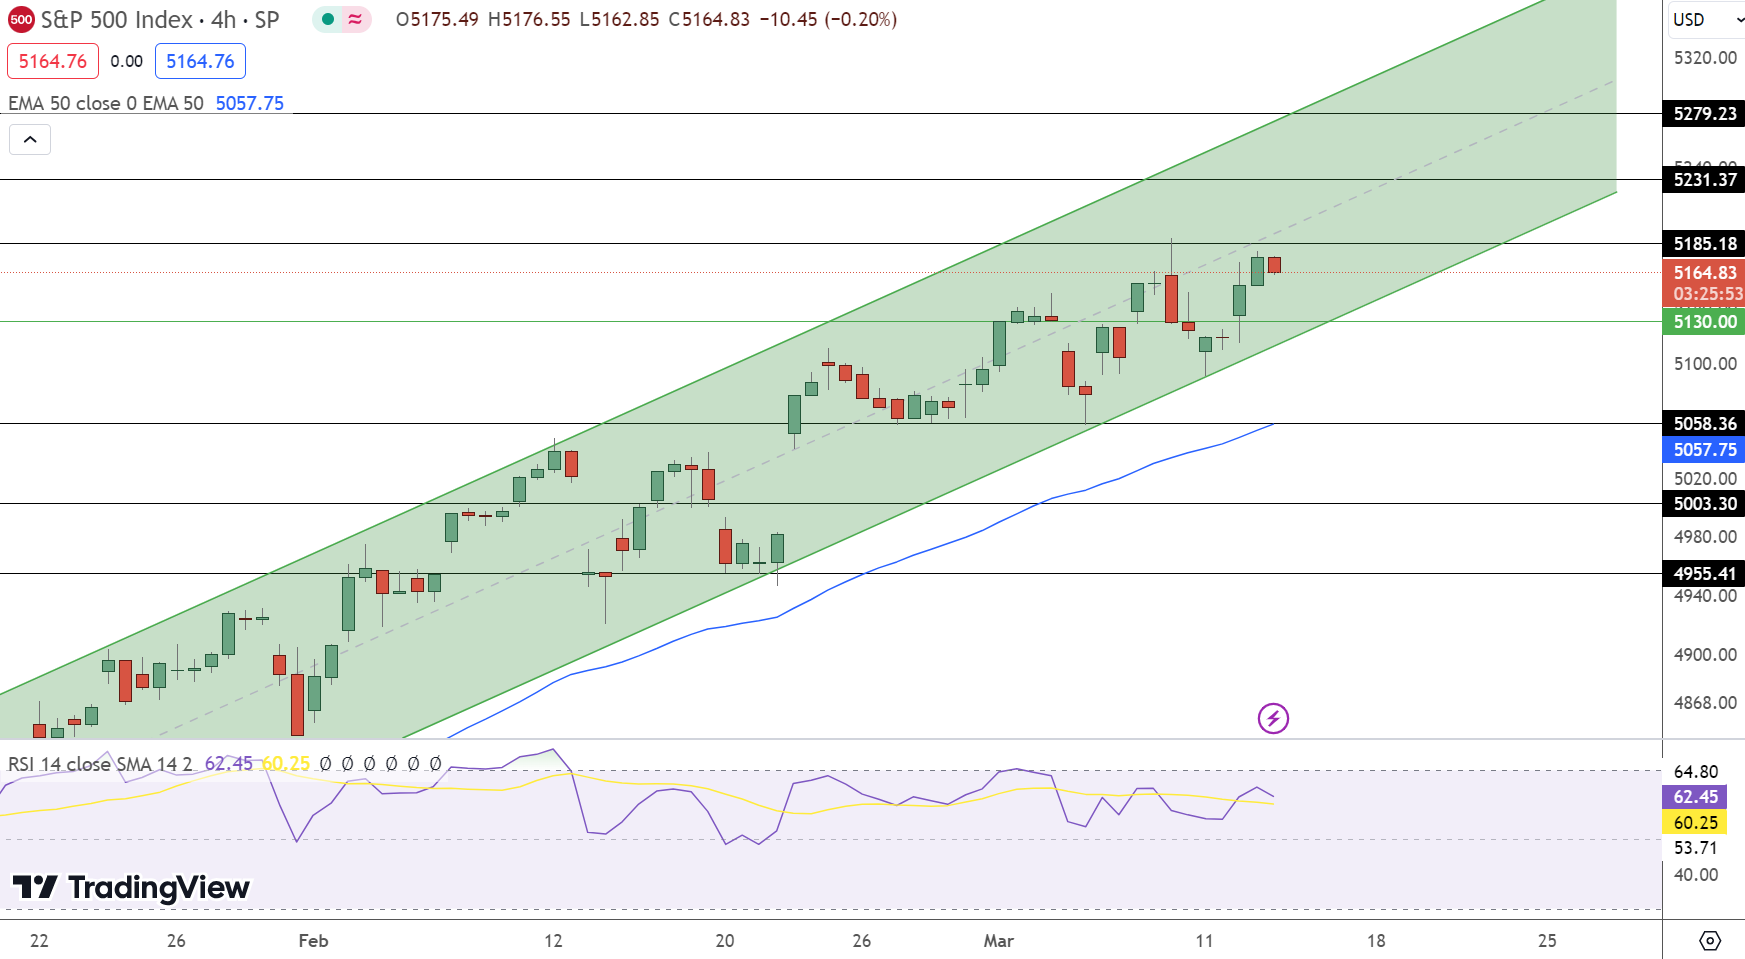
In today’s S&P 500 (SPX) technical outlook, the index slightly declined by 0.12% to close at $5,164.83. Despite the minor setback, the technical landscape suggests an underlying strength.
The pivot point at $5,130.00 serves as a critical juncture; staying above this level could maintain the index’s bullish posture.
Immediate resistance lies ahead at $5,185.18, with further barriers at $5,231.37 and $5,279.23, potentially capping upward movements. On the downside, support levels are identified at $5,058.36, $5,003.30, and $4,955.41, offering floors for any pullbacks.
The Relative Strength Index (RSI) at 62 indicates a somewhat overbought condition but doesn’t necessarily signal an immediate reversal.
The 50-day Exponential Moving Average (EMA) at $5,057.75 further underscores the upward trend. Collectively, these indicators suggest that as long as SPX remains above the pivot point of $5,130.00, the market’s bias leans bullish.
- Check out our free forex signals
- Follow the top economic events on FX Leaders economic calendar
- Trade better, discover more Forex Trading Strategies
- Open a FREE Trading Account
- Read our latest reviews on: Avatrade, Exness, HFM and XM

Related Articles



Sidebar rates

Related Posts
 Save
Save