USD to NZD Rate Stable After China Manufacturing, Services PMI
The USD to NZD rate has shown relatively stable movement within a narrow band of 80 pips and today's Chinese data couldn't break the range.

The USD to NZD exchange rate has shown relatively stable movement within a narrow band of 80 pips over the past two weeks, indicating a period of consolidation. Earlier in the month, the exchange rate began to rise, surpassing the 0.61 mark, primarily triggered by lower US CPI inflation statistics for April.

This upward movement in the USD to NZD exchange rate aligns with the broader trend of the New Zealand dollar’s relative strength against the US dollar, observed since the beginning of April. Weakness in US economic data has contributed to pressure on the US dollar. However, throughout the second half of May, the market has been largely confined between various moving averages.
NZD/USD Chart Daily – Consolidating Between 2 MAs
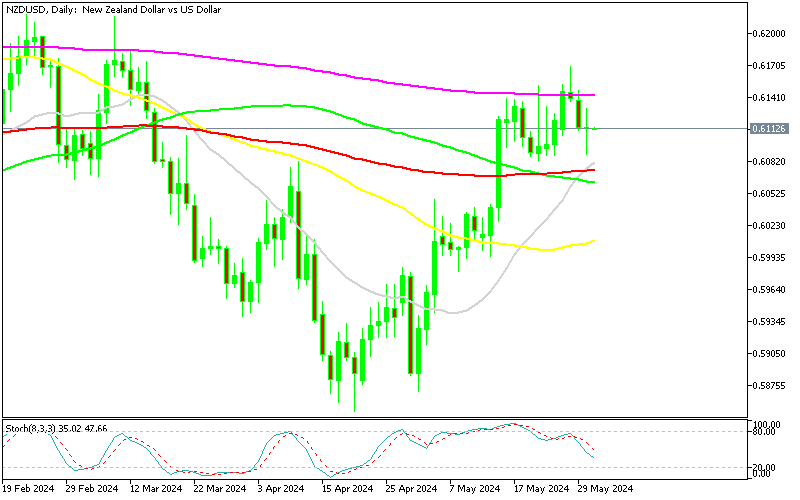
In early May, the NZD/USD pair breached above the 50-day Simple Moving Average (SMA), indicating a potential shift in trend direction. Subsequently, by mid-month, the pair rose above the 100 SMA (red), further reinforcing the notion of a changing trend. However, the 200 SMA has acted as a significant resistance level, with buyers unable to overcome it thus far. Last night we had the Manufacturing and Services PMI data from China, which gave the price bit of a shake but it didn’t break the range.
Chinese Manufacturing and Services PMI for May
NZD/USD Live Chart
- Check out our free forex signals
- Follow the top economic events on FX Leaders economic calendar
- Trade better, discover more Forex Trading Strategies
- Open a FREE Trading Account
- Read our latest reviews on: Avatrade, Exness, HFM and XM

Related Articles


Sidebar rates

Related Posts
 Save
Save