WTI Crude Oil Falls to Four-Month Low on OPEC+ Production Cut Signal; Buy Above $77?
Oil prices recently fell to a four-month low, extending losses after OPEC+ signaled plans to reduce production cuts.

Oil prices recently fell to a four-month low, extending losses after OPEC+ signaled plans to reduce production cuts.
In a weekend meeting, OPEC+ decided to maintain 3.6 million barrels per day of cuts until the year’s end. However, the cartel will start scaling back 2.2 million barrels per day from September 2024 to October 2025. This move was perceived as bearish, suggesting limited capacity for OPEC+ to support prices further.
Weak Economic Indicators Raise Demand Concerns
Weak economic data has also contributed to the decline in oil prices. The U.S. purchasing managers index showed manufacturing activity contracted for the second consecutive month in May, raising fears of reduced demand in the world’s largest fuel consumer.
This reading indicated that persistent inflation and high interest rates might be hampering economic activity, thus weakening demand for oil.
Additionally, market focus is on upcoming key labor market readings from the U.S., which could influence the outlook for interest rates, with a potential September rate cut by the Federal Reserve under consideration.
Mixed PMI readings from China, the top oil importer, further added to market jitters, showing an unexpected contraction in its manufacturing sector. This has raised concerns about the strength of demand from China, which significantly impacts global oil markets.
Geopolitical Developments and Market Sentiment
Furthermore, oil traders are factoring in potential geopolitical stability. The U.S. is attempting to broker a ceasefire between Israel and Hamas, which could lead to more stable conditions in the Middle East.
A ceasefire would reduce the geopolitical risk premium on oil, contributing to lower prices.
WTI Crude Oil Price Forecast: Technical Outlook
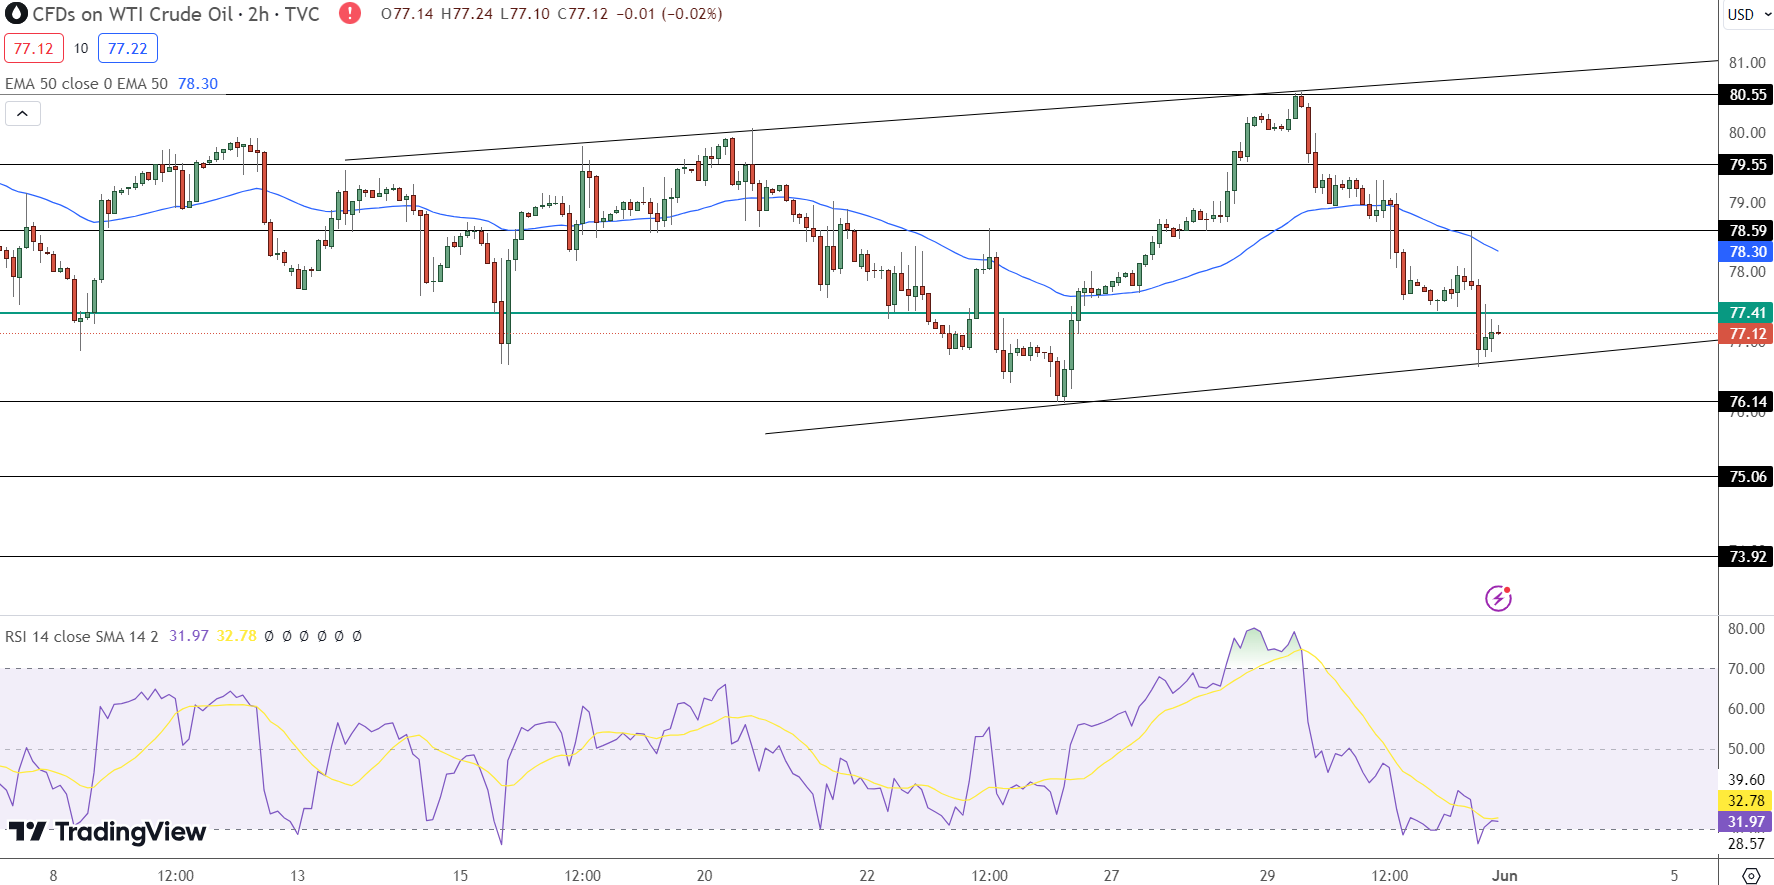
WTI Crude Oil (USOIL) is trading at $77.12, showing a slight decline of 0.02%. The pivot point at $77.41 is a crucial support level. Immediate resistance levels are $78.30, $79.55, and $80.55.
Support levels are $76.14, $75.06, and $73.92. The Relative Strength Index (RSI) is at 32.78, indicating oversold conditions. The 50-day Exponential Moving Average (EMA) is at $78.30, acting as resistance.
An upward trendline supports USOIL near $77.10. Closing above this level may drive a buying trend towards the $78.60 EMA level. Conversely, a fall below $77.10 could signal further declines.
- Check out our free forex signals
- Follow the top economic events on FX Leaders economic calendar
- Trade better, discover more Forex Trading Strategies
- Open a FREE Trading Account
- Read our latest reviews on: Avatrade, Exness, HFM and XM

Related Articles

Sidebar rates

Related Posts
 Save
Save