Bearish Engulfing Pattern in Gold After Strong US Services
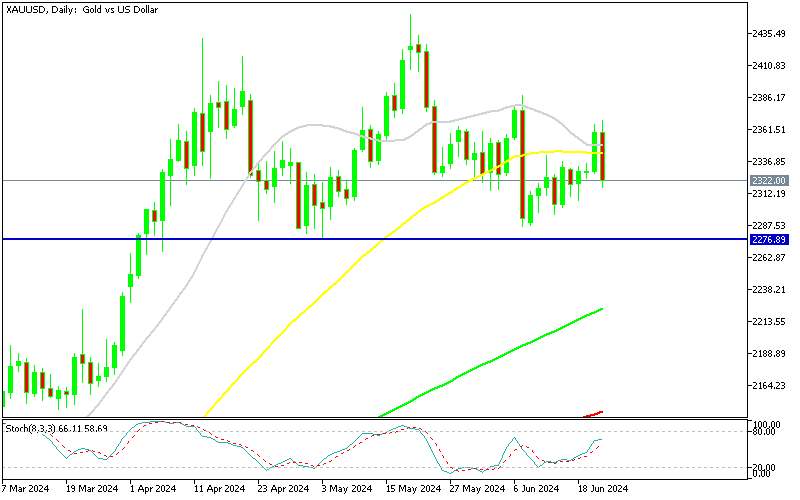
Gold opened bullish on Friday after climbing more than 1% on Thursday, but the decline on Friday engulfed the previous candlestick.

Gold opened bullish on Friday after climbing more than 1% on Thursday to reach a two-week high. This rise was driven by recent weak economic data from the United States, which has increased investor confidence that the Federal Reserve might be able to reduce interest rates later this year. Early Friday, market investors were pricing in a 66% chance of a rate cut in September, but on Friday the price reversed lower, and ended up around $50 down from the top.
Gold Chart Daily – Friday’s Candlestick Engulfs Thursday’s One
US Services and Manufacturing Show Resilience
The sharp reversal in the GOLD price yesterday introduced some concerns from a technical perspective. The robust US manufacturing and services data contributed to this negative turnaround, challenging the bullish sentiment. The US June S&P Global flash PMI data showcased robust performances in both the services and manufacturing sectors. The Services PMI climbed to 55.1 points, exceeding the expected 53.7 points and improving from the previous 54.8 points. Similarly, the Manufacturing PMI outperformed expectations, coming in at 51.7 points against the forecasted 51.0 points, up from the prior 51.3 points.
The Composite PMI also inched higher to 54.6 points, just above the anticipated 54.5 points. Notably, selling prices reached their lowest levels in the past four years, hitting a five-month low, which may signal easing inflationary pressures. Business confidence has strengthened, particularly in the service sector, reflecting an optimistic outlook for the year ahead. This improvement is driven by rising demand, which is increasing pressure on operating capacity.
The future prospects in the services sector have reached a five-month high, and payrolls in this sector have seen the most significant increase in five months, helping to counterbalance some of the declines observed over the past two months. These indicators point to a resilient economic outlook, with the service sector playing a crucial role in maintaining positive momentum.
Gold Technical Analysis
For the past two months, Gold has appeared to be forming a head-and-shoulders top, with the neckline around $2,270s suggesting a potential rise toward $2,180. Early on Friday, Gold buyers attempted to break above this month’s high, but the effort failed. Later on the day, Gold sellers returned, driving the price down by $50 to $2,31670. This recent action suggests that while there is still underlying bullish sentiment, the path upward is very difficult and buyers face significant resistance.
Gold Live Chart
- Check out our free forex signals
- Follow the top economic events on FX Leaders economic calendar
- Trade better, discover more Forex Trading Strategies
- Open a FREE Trading Account
- Read our latest reviews on: Avatrade, Exness, HFM and XM

Related Articles



Sidebar rates

Related Posts
 Save
Save