Gold Skyrockets to $5,400: Global Markets Panic as US-Iran Conflict Shuts Strait of Hormuz
Geopolitical chaos has pushed the world’s ultimate safe-haven asset to its limits. On March 2, 2026, spot gold surged toward the $5,400...
Quick overview
- Gold prices surged toward $5,400 per ounce amid escalating geopolitical tensions and military actions in the Middle East.
- The closure of the Strait of Hormuz has raised concerns about global trade and energy-driven inflation, with Brent crude prices spiking.
- Analysts predict that if the conflict expands, gold could potentially reach $6,000 per ounce by the end of the year.
- Traders are advised to monitor key resistance and support levels as they navigate the current market volatility.
Geopolitical chaos has pushed the world’s ultimate safe-haven asset to its limits. On March 2, 2026, spot gold surged toward the $5,400 per ounce mark, gaining nearly 3% in a single session. The rally comes as the joint U.S.-Israeli military campaign enters its third day, triggering a “risk-off” flight from global equities and cryptocurrencies into the safety of bullion.
With the Strait of Hormuz, the world’s most vital oil artery, effectively closed and Brent crude spiking toward $82 per barrel, investors are bracing for a prolonged period of energy-driven inflation and regional instability.
War Update: Strikes Intensify as “Strait” Concerns Grow
The military situation escalated significantly over the weekend. Following reports of the death of Iran’s Supreme Leader, military actions have expanded across multiple fronts:
- 1,000+ Targets Hit: US. and Israeli forces have reportedly struck over 1,000 sites, focusing on ballistic missile infrastructure and naval assets.
- The Hormuz Blockade: In a direct blow to global trade, Iran’s Revolutionary Guard has restricted passage through the Strait of Hormuz. Maersk and other shipping giants have already suspended transit, fearing missile attacks on tankers.
- S. Casualties: The Pentagon has confirmed the first American combat deaths of the operation, 3 service members killed, prompting President Trump to vow that operations will continue until all objectives are met.
Gold by the Numbers: Breaking Historical Barriers
Gold’s performance in early 2026 has been nothing short of historic. While many expected a “grind higher,” the current conflict has turned the move into a vertical spike:
- $5,397: Peak intraday price reached during the Asia-Europe session.
- +2.8%: Single-day gain, one of the largest in recent years.
- +85%: Year-over-year increase, dwarfing the returns of the S&P 500 and Bitcoin.
Analysts from UBS and J.P. Morgan now suggest that if the conflict widens to include direct involvement from other regional powers, gold could test $6,000 per ounce before the end of the year.
Technical Outlook: Can Gold Hold $5,300?
From a technical perspective, Gold (XAU/USD) is currently testing its “upper gate” resistance. While the momentum is undeniably bullish, professionals are watching for signs of a temporary pullback.
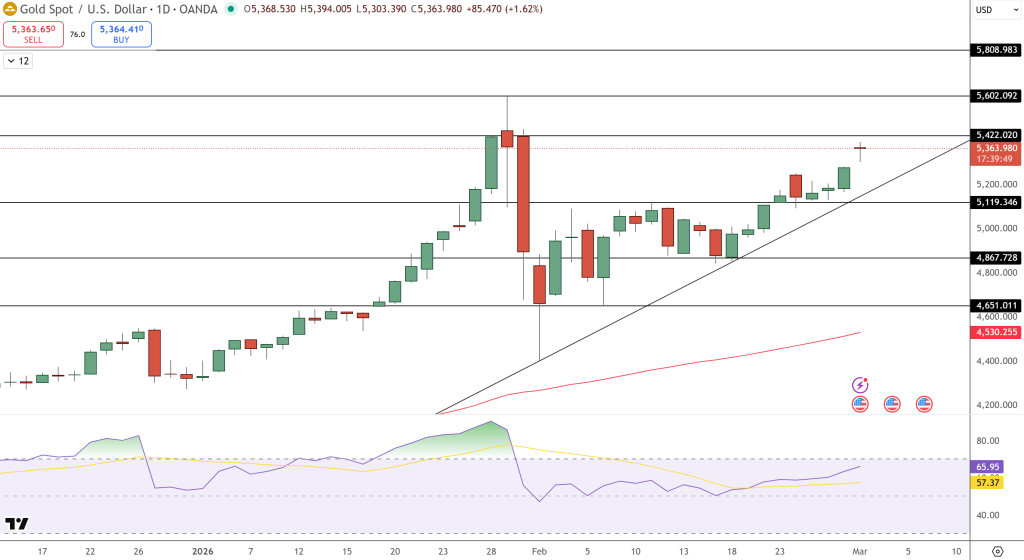
- Resistance: The immediate hurdle is $5,422. If bulls break this level, the path to the all-time high of $5,602 (set in January) becomes wide open.
- Support: The primary floor has shifted upward to $5,300. As long as gold stays above this “line in the sand,” the uptrend remains healthy.
- RSI Check: The Relative Strength Index is sitting at 65. This indicates strong bullish momentum but, crucially, it is not yet in “extreme overbought” territory (above 70), meaning there is still room for more upside.
Strategy: Hedging Against a Long War
For traders and investors, the “buy the dip” strategy has proven highly effective since October 2025.
The Bull Scenario: A breakout above $5,422 targets the $5,600 region. Many professionals are using physical gold or gold ETFs to hedge against potential equity market crashes caused by rising oil prices.
The Bear Scenario: A sudden de-escalation or “ceasefire talk” could trigger a sharp profit-taking move. Watch the $5,119 level as the ultimate invalidation of the current rally.
- Check out our free forex signals
- Follow the top economic events on FX Leaders economic calendar
- Trade better, discover more Forex Trading Strategies
- Open a FREE Trading Account
- Read our latest reviews on: Avatrade, Exness, HFM and XM
Related Articles


Sidebar rates
Related Posts
