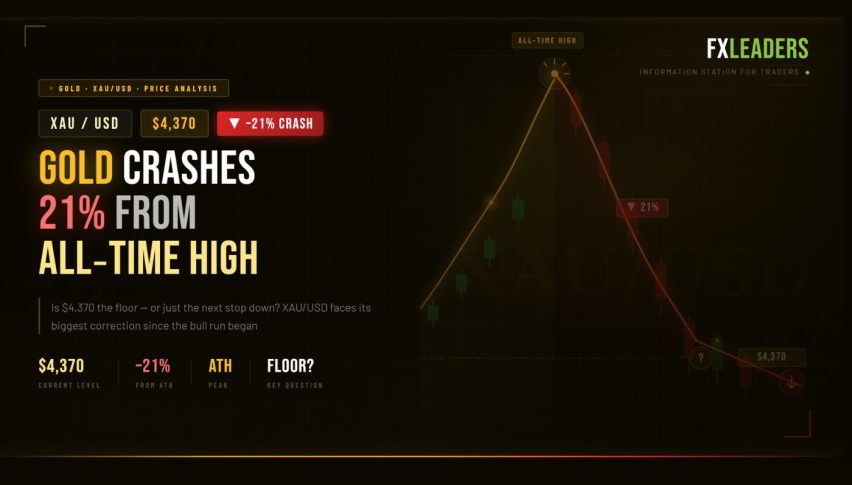
Gold Price Analysis: XAU/USD Crashes 21% From All-Time High – Is $4,370 the Floor or Just the Next Stop Down?
Gold is at a make-or-break technical level. XAU/USD is trading near $4,431 on March 27, 2026 — roughly 21% below the $5,589...
Quick overview
- Gold is currently trading near $4,431, approximately 21% below its all-time high, and is at a critical technical level as it approaches the apex of a symmetrical triangle.
- The recent decline in gold prices was triggered by a hawkish shift in the Fed's rate cut projections, leading to increased real yields and a stronger dollar.
- Today's US PCE inflation data is crucial, as a hot reading could reinforce bearish sentiment, while a soft reading may reignite bullish expectations for gold.
- Despite the recent downturn, major banks maintain a bullish long-term outlook for gold, with targets ranging from $4,700 to $6,000 for 2026.
Gold is at a make-or-break technical level. XAU/USD is trading near $4,431 on March 27, 2026 — roughly 21% below the $5,589 all-time high struck in January — sitting on a symmetrical triangle that is approaching its apex. With US PCE inflation data landing today, the next 24 hours could define whether $4,373 is a floor or a stepping stone lower.
Why Has Gold Crashed 21% From Its All-Time High?
Gold’s January rally above $5,000 for the first time in history was historic. The reversal has been equally dramatic — and the reasons are specific.
The pivotal breakdown came on March 18, when gold crashed 3.7% in a single session, closing below its 50-day moving average at $4,960 and confirming that the February recovery was a dead cat bounce, not a trend reversal. What triggered it was the Fed’s hawkish dot plot: the FOMC revised its 2026 rate cut projections from two cuts to one, citing February’s PPI at +0.7% — well above consensus — and flagging that the Strait of Hormuz-driven oil spike was creating inflation persistence that prevents easing.
The result: the 10-year Treasury real yield jumped to 4.2%, the Dollar Index climbed toward 99.9, and gold — a non-yielding asset — sold off sharply.
CME FedWatch now shows zero cuts priced across all of 2026, down from three cuts expected at the start of the year. Since gold pays no yield, rising real interest rates directly increase the opportunity cost of holding it. Add a stronger dollar and hawkish signals from both the ECB and BoE — driven by energy-shock inflation — and the macro headwinds facing gold are substantial and interconnected.
There is also a narrative shift worth noting. Bloomberg Intelligence’s Mike McGlone raised the possibility that gold may have shifted from a safe-haven asset to a speculative risk asset — a framing that, if it takes hold in positioning, would change the playbook entirely.
XAU/USD Technical Analysis: A Triangle at the Apex
The 2-hour chart tells a clear structural story.
A descending channel from the $5,100 distribution top has rejected every meaningful recovery attempt, with the long-term EMA pressing down near $4,670, reinforcing the downtrend. The drop from $4,805 to the $4,101 swing low was near-vertical — consistent with institutional offloading rather than retail stop-hunting.
Since that capitulation, price has compressed into a symmetrical triangle between the descending channel resistance and a rising trendline from the $4,101 low. This triangle is now approaching its apex near current price. A directional break is imminent, and the indicators are not giving a clear lean either way:
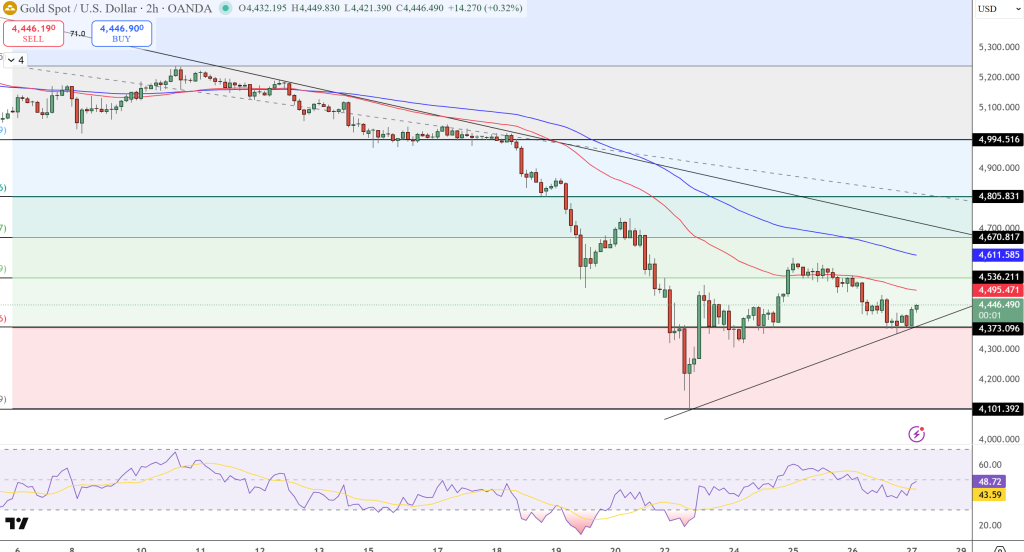
- RSI at 43–48 is drifting below the neutral 50 line — neither recovery nor panic
- A mild bullish RSI divergence formed off the $4,101 low, hinting at selling exhaustion
- But bulls have failed to push RSI back above 60 on any bounce, which keeps the bearish case alive
The 200-day EMA at approximately $4,200 is the critical bull/bear dividing line for the broader trend. Gold has not traded below that level since late 2023. A sustained break below $4,200 would open the path toward $3,500 — the origin of the entire 2025–2026 rally.
XAU/USD trade setup (long bias off support): Buy on confirmed bullish engulfing candle at $4,373 support | Stop below $4,300 | Target $4,536, then $4,611.
Key Gold Support and Resistance Levels — March 27, 2026
Support: $4,373 (current make-or-break level) → $4,300 (stop zone) → $4,200 (200-day EMA / bull-bear line) → $4,101 (swing low) → $3,500 (structural origin)
Resistance: $4,536 → $4,611 → $4,670 (long-term EMA) → $4,960 (50-day MA / former support) → $5,000 (psychological)
Today’s US PCE Data: The Deciding Catalyst for Gold
Today’s US PCE print — the Federal Reserve’s preferred inflation gauge — is the single most important data point for gold right now.
Hot PCE reading: Reinforces the zero-cuts-in-2026 narrative, pushes Treasury yields and the dollar higher, and sends gold back toward $4,300 and the 100-day SMA. Bears regain control.
Soft PCE reading: Reignites rate cut expectations, weakens the dollar, and gives bulls the fuel to break channel resistance and target $4,536–$4,611. A genuine trend reversal signal.
There is no middle ground here. The PCE print will likely force a resolution of the symmetrical triangle that has been compressing price for the past several sessions.
Gold Long-Term Outlook: Structural Bull Case vs Near-Term Bear Reality
Despite the brutal correction, major institutional forecasts remain bullish over the longer term. Goldman Sachs holds a year-end target of $5,400, citing central bank buying that remains well above pre-2022 levels. J.P. Morgan goes further, forecasting $6,000 if global de-dollarisation continues. The consensus from major bank desks clusters around a $4,700–$5,000 median for 2026, with tail upside to $5,400–$5,700.
The structural pillars underpinning that bullish case are intact: US national debt approaching $39 trillion, continued central bank diversification away from the dollar (850+ tonnes of purchases projected in 2026), and gold ETFs still holding enormous inventories despite modest outflows.
But near-term, the bears hold the momentum edge until $4,373 holds. A break below $4,200 on the 200-day EMA would be a structurally significant event — not just a deeper correction, but a potential signal that the 2025–2026 bull cycle is entering a more serious reassessment phase.
FAQ: Gold Price Crash – Causes, Levels, and What Comes Next
Why is gold falling in 2026 after hitting all-time highs?
Gold’s crash from its $5,589 all-time high is being driven by a sharp repricing of Fed rate cut expectations. CME FedWatch now shows zero cuts priced for 2026, down from three at the start of the year. Rising real Treasury yields increase the opportunity cost of holding non-yielding gold, while a stronger US dollar adds a second layer of headwind. The removal of the Iran war premium after ceasefire talks also reduced safe-haven demand.
What is the gold price forecast for 2026?
Major banks remain broadly bullish over the full year. Goldman Sachs targets $5,400 by year-end, JP Morgan forecasts $6,000 in a de-dollarisation scenario, and the broad institutional consensus clusters around $4,700–$5,000. However, the near-term technical bias is bearish, with $4,373 the critical support level today and $4,200 (200-day EMA) the structural bull/bear line.
What is the key support level for XAU/USD right now?
The most critical near-term support is $4,373. Below that, $4,300 is the stop zone, and $4,200 — where the 200-day EMA sits — is the structural line separating a bull trend from a potential bear trend. Gold has not closed below the 200-day EMA since late 2023.
How does US PCE data affect gold prices?
PCE is the Federal Reserve’s preferred inflation gauge. A hot PCE reading strengthens the case for keeping rates high, which pushes real Treasury yields up and the dollar higher — both direct headwinds for gold. A soft PCE print does the opposite: it reignites rate cut expectations, weakens the dollar, and gives gold bulls the fuel to stage a recovery. Today’s PCE is the key directional trigger for XAU/USD.
How do real interest rates affect gold?
Gold pays no yield. When real interest rates rise — as they have since the Fed signalled zero cuts in 2026 and Treasury yields jumped to 4.2% — the opportunity cost of holding gold increases relative to bonds. This mechanical relationship is the primary driver of gold’s current correction and the most important macro variable to track for the near-term outlook.
Is gold still a good long-term investment after this crash?
The structural case remains intact. Central banks globally are projected to purchase 850+ tonnes of gold in 2026, US national debt is approaching $39 trillion, and the global de-dollarisation trend continues. These are long-duration tailwinds. The current crash is a sharp correction within a longer bull cycle — not a structural reversal — as long as the $4,200 200-day EMA holds.
- Check out our free forex signals
- Follow the top economic events on FX Leaders economic calendar
- Trade better, discover more Forex Trading Strategies
- Open a FREE Trading Account
- Read our latest reviews on: Avatrade, Exness, HFM and XM
Related Articles


Sidebar rates
Related Posts
Ava

