AMD Stock Hits New ATH After Massive Breakout Rally

Quick overview
- AMD stock has surged nearly 76% this month, reaching a new all-time high of $353 after a five-month correction.
- The stock's breakout above the $240 resistance indicates strong bullish momentum, supported by positive EMA and MACD signals.
- However, signs of potential exhaustion are emerging, with the RSI approaching overbought territory and MACD histograms showing weakening momentum.
- Key support levels to watch include the $240 to $267 range, with additional Fibonacci supports at $247 and $175.
AMD stock is on an explosive rally this month, surging nearly 76% and hitting a new all-time high of $353. The question now: is there more upside ahead?
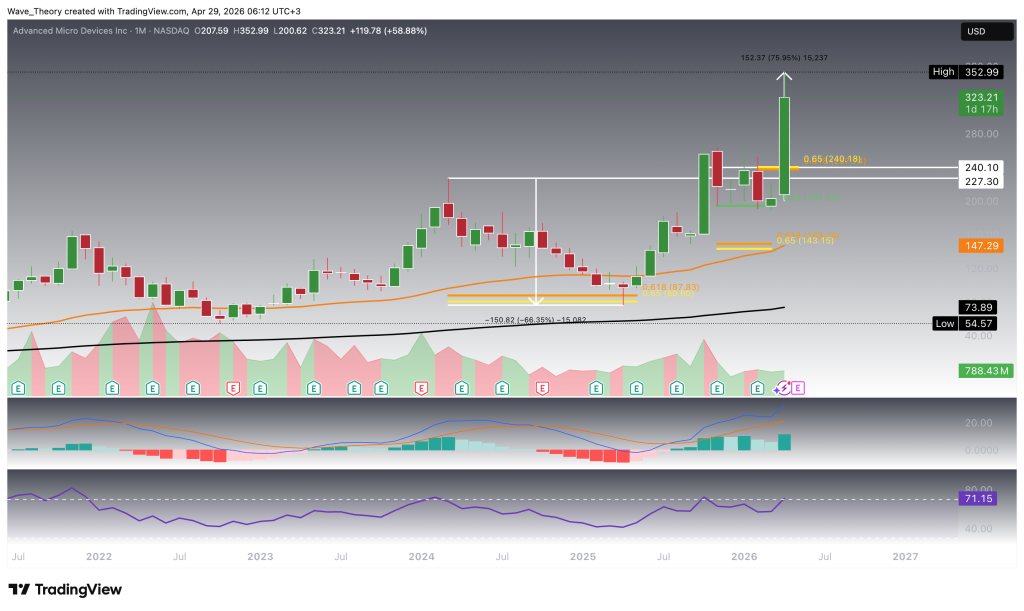
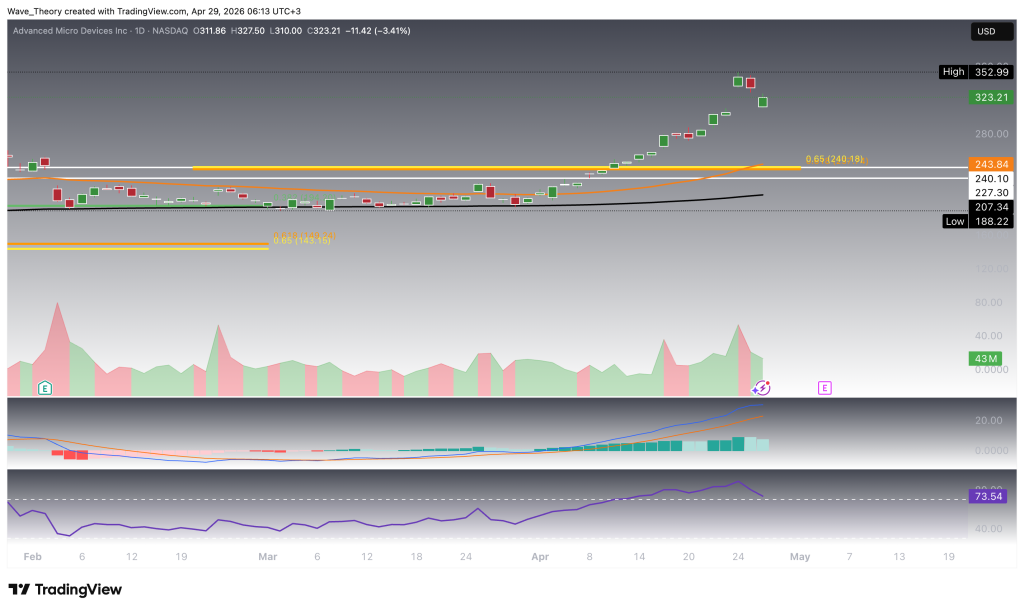
AMD Stock Breaks Out to New All-Time High at $353
After undergoing a prolonged five-month correction phase, AMD has staged an impressive recovery, validating strong underlying demand. The stock successfully held the 0.382 Fibonacci support at $194 on two separate occasions, reinforcing this level as a structurally significant demand zone. Building on this base, AMD decisively broke through the golden ratio resistance at $240 earlier this month-triggering a powerful impulsive move to the upside, with gains exceeding 75%.
This breakout has now culminated in the formation of a new all-time high at $353, signaling sustained bullish momentum and opening the door for potential continuation to higher price levels.
From a trend perspective, the EMA structure has confirmed a bullish regime shift, with a golden crossover in place – typically indicative of strengthening long-term momentum and trend continuation. Momentum indicators further support this outlook: the MACD lines have crossed bullishly, while the MACD histogram has been consistently printing higher values throughout the month, reflecting increasing upside momentum.
However, there are early signs of potential exhaustion. The RSI is approaching overbought territory and appears to be on the verge of forming a bearish divergence, which could signal weakening momentum beneath the surface.
In the event of a corrective move, key historical support is expected to emerge within the $240 to $267 region – an area that previously acted as resistance and may now serve as a demand zone on any pullback.
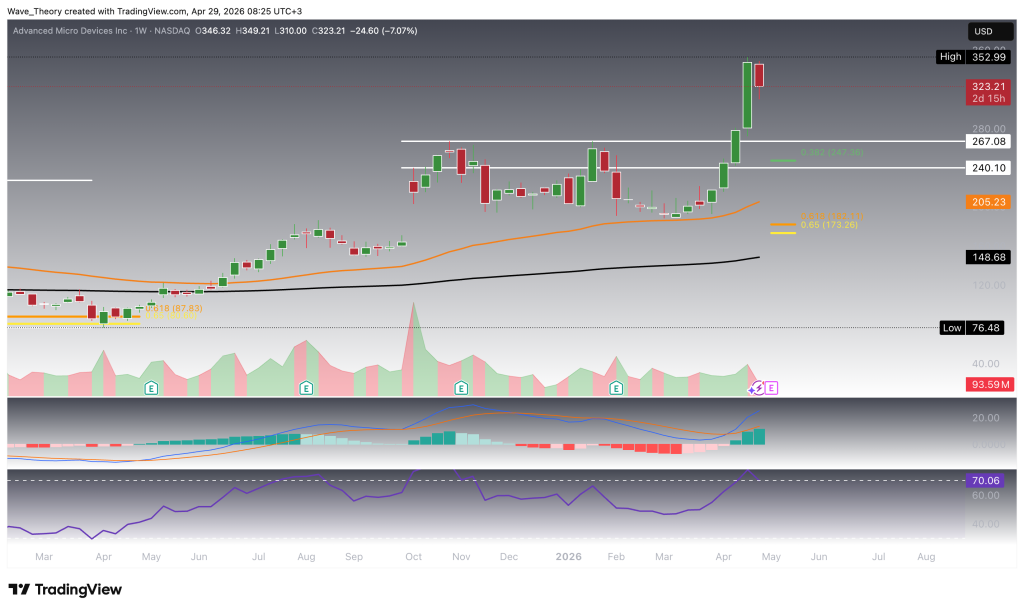
Next Fibonacci Supports Emerge at $247 and $175
On the weekly timeframe, AMD continues to exhibit a structurally bullish setup, with indicators aligning in favor of sustained upside momentum. The EMA structure remains firmly intact, with a confirmed golden crossover signaling a bullish mid-term trend and reinforcing the strength of the current market phase.
Momentum indicators further validate this outlook. The MACD lines are bullishly crossed, while the MACD histogram has been printing progressively higher values for several consecutive weeks—an indication of building upside momentum and trend acceleration.
The RSI, meanwhile, is approaching overbought territory but remains neutral in terms of directional bias, offering neither a clear bullish continuation signal nor a confirmed bearish divergence at this stage.
In the event of a more pronounced correction, AMD is likely to find its next significant Fibonacci-based support zones at $247 and $175. These levels represent key structural areas where demand could re-enter the market, potentially acting as stabilization points within a broader bullish trend.
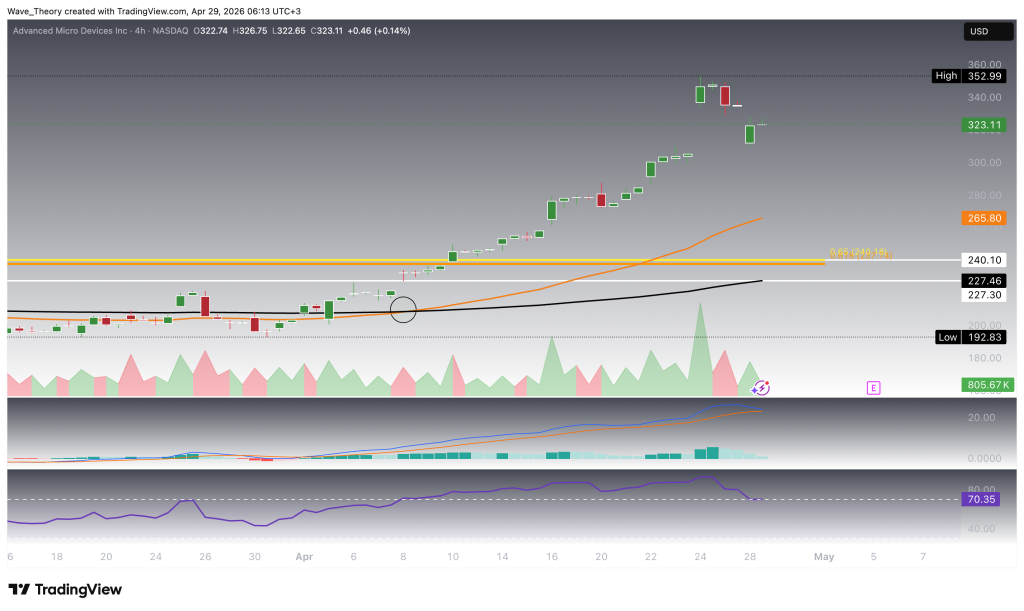
Similar Outlook on the 4H Chart
On the 4H timeframe, AMD presents a largely similar technical structure to the daily chart, reflecting a short-term bullish trend that is beginning to show signs of fatigue. The EMA configuration remains constructive, with a confirmed golden crossover signaling that the prevailing short-term trend is still tilted to the upside.
However, momentum is clearly deteriorating beneath the surface. The MACD histogram has been ticking progressively lower, indicating a steady loss of bullish momentum. At the same time, the MACD lines are approaching a bearish crossover, which—if confirmed—would further validate a shift toward short-term downside pressure.
The RSI has also cooled off, retreating from previously elevated levels back into neutral territory. While this removes immediate overbought conditions, it simultaneously reflects a lack of strong bullish conviction in the current phase.
Overall, the 4H chart reinforces the broader narrative: while trend structure remains bullish, momentum is weakening, increasing the likelihood of continued consolidation or a short-term corrective move before the next impulsive leg.
- Check out our free forex signals
- Follow the top economic events on FX Leaders economic calendar
- Trade better, discover more Forex Trading Strategies
- Open a FREE Trading Account
- Read our latest reviews on: Avatrade, Exness, HFM and XM
Related Articles


Sidebar rates
Related Posts
