Silver Surges to $77.55 as Ceasefire Holds & Deficit Deepens – $79.86 Next?
As of the 6th of May 2026, spot silver (XAG/USD) is ticking up towards $77.55 an ounce. It's having a pretty good day, up about 0.80%...
Quick overview
- As of May 6, 2026, spot silver (XAG/USD) is rising towards $77.55 an ounce, up about 0.80%.
- The U.S.-Iran ceasefire is holding, easing geopolitical risks and positively impacting industrial metals.
- The silver market is facing its sixth consecutive annual shortfall, with a projected deficit of 46.3 million ounces in 2026.
- Strong demand from sectors like solar energy and electronics, along with a bullish long-term outlook, is expected to push silver prices higher.
As of the 6th of May 2026, spot silver (XAG/USD) is ticking up towards $77.55 an ounce. It’s having a pretty good day, up about 0.80% and – by the looks of it – continuing a recent little recovery.
Key Drivers Today
- The Ceasefire Holds: It’s almost been a month since that U.S.-Iran ceasefire deal was agreed – a conditional one, to be sure – and so far its holding up pretty well, with some tanker traffic starting to move through the Strait of Hormuz again. This has all helped ease the geopolitical risk premium a bit, allowing things like industrial metals to actually respond to what’s really going on in the market.
- Structural Deficit Worsens: The silver market is now expecting its sixth annual shortfall in a row in 2026, this time at 46.3 million ounces – 15% worse than last year. Since 2021, the silver market has drawn down around 762 million ounces of the above ground stocks that it had. That’s a pretty worrying low.
- Industrial & Investment Demand Goes Strong: We’re seeing solid demand from the solar energy, electronics, and EV sector. China is also importing a lot of silver right now, which is really tightening up supplies. Jewellery demand is still pretty price sensitive, but we’re seeing more people investing in silver bars and coins.
- Longer Term Outlook Remains Bullish: The experts are still pretty optimistic (even Bank of America) because of this chronic undersupply and the fact that silver plays a couple different roles. This could push prices up later in the year.
Silver (XAG/USD) Technical Analysis
Silver’s finally broken out on the 4 hour chart – closing above that 1.0 fib level of $76.95, and also above the red moving average. This after it had a little respect for that .618 retracement at around $75.15. It’s now heading for the 1.272 extension level at $78.24 while also still riding above that rising trendline.
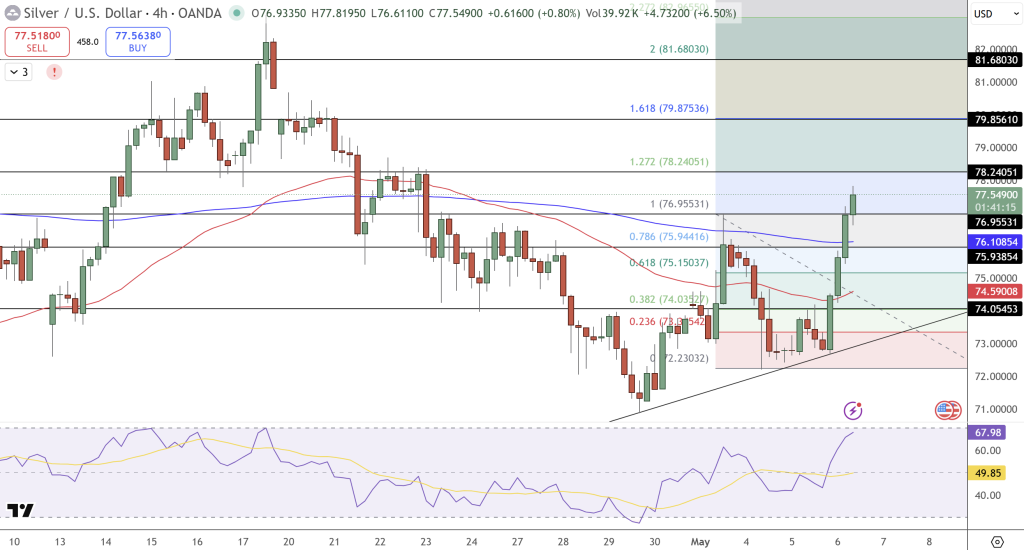
The structure shows higher lows going back to late April when we saw a low at the .236 fib level at $73.15 – broke out of a little consolidation triangle since then. We also have multiple fib clusters with support at $76.11–$75.94 – RSI is climbing up towards 68 too, with some positive divergence to go along with that. So yeah, looks like the momentum is still pretty bullish.
Key Levels
- Resistance: $78.24 → $79.86 (1.618 fib)
- Support: $76.11 → $75.15 → $74.05
Trade Idea: Buy above $77.80, targeting $79.86, stop below $76.11. Things will probably depend pretty heavily on whether that ceasefire deal sticks, how the industrial data is looking, and the overall mood of the market.
- Check out our free forex signals
- Follow the top economic events on FX Leaders economic calendar
- Trade better, discover more Forex Trading Strategies
- Open a FREE Trading Account
- Read our latest reviews on: Avatrade, Exness, HFM and XM
Related Articles
Sidebar rates
Related Posts
