Crude Oil Price Forecast: USOIL at $100.57 Rises 0.31% as Ceasefire Holds – $104 Breakout Next?
As of 14th May 2026, WTI Crude Oil (USOIL) is trading around $100.57 a barrel, up a fairly modest 0.31% on the day, while chugging...
Quick overview
- As of May 14, 2026, WTI Crude Oil is trading at $100.57 a barrel, reflecting a modest increase of 0.31%.
- The U.S.-Iran ceasefire is holding, easing geopolitical risks that previously impacted oil prices.
- Supply and demand dynamics are stabilizing, with increased oil flow through the Strait of Hormuz and robust U.S. production.
- Market participants are closely monitoring upcoming U.S. inventory reports and the next OPEC+ meeting for potential supply changes.
As of 14th May 2026, WTI Crude Oil (USOIL) is trading around $100.57 a barrel, up a fairly modest 0.31% on the day, while chugging along in a relatively tame range.
Key Drivers for Today
- The Ceasefire Situation: The U.S.-Iran ceasefire which is now well over a month old, is still holding – albeit in a fragile state – and thanks to incremental progress on tanker movements through the Strait of Hormuz, it’s largely had the effect of easing that acute geopolitical risk premium which sent oil prices into a tailspin back in March and April.
- Supply and Demand are Looking More Balanced: A bit more oil is flowing through the critical Strait of Hormuz, and that’s helped calm things down a bit when it comes to supply worries. And with the U.S. production levels being pretty robust and OPEC+ making some output adjustments – things are looking a bit more like normal.
- Demand is Starting to Recover: Consumption of oil is starting to pick up in some areas after the price cuts that followed the ceasefire, but demand in the price sensitive emerging markets is still being pretty cautious.
- Things to Watch For: Everyone is keeping an eye on coming U.S. inventory reports and the next OPEC+ ministerial meeting for some serious clues about what’s going to happen to oil supplies in the short term.
USOIL is in one of those classic post-crisis phases where it’s trying to transition from all the crazy headlines and extremes back to the relatively more mundane world of seasonal and inventory driven price moves – and as long as the ceasefire stays in place the whole thing should be pretty uneventful. But one wrong move, and any diplomatic setbacks could quickly send oil prices on a wild ride again.
WTI Crude Oil Technical Stuff
WTI has gone and formed a bit of a hammer on the 2H chart after it re-tested the black trendline from that low in the middle of May around $93.83. Price is respecting the channel midline and that red moving average resistance around $102.86–$104.59, while the blue moving average is putting in some secondary support around $99.43–$100.33.
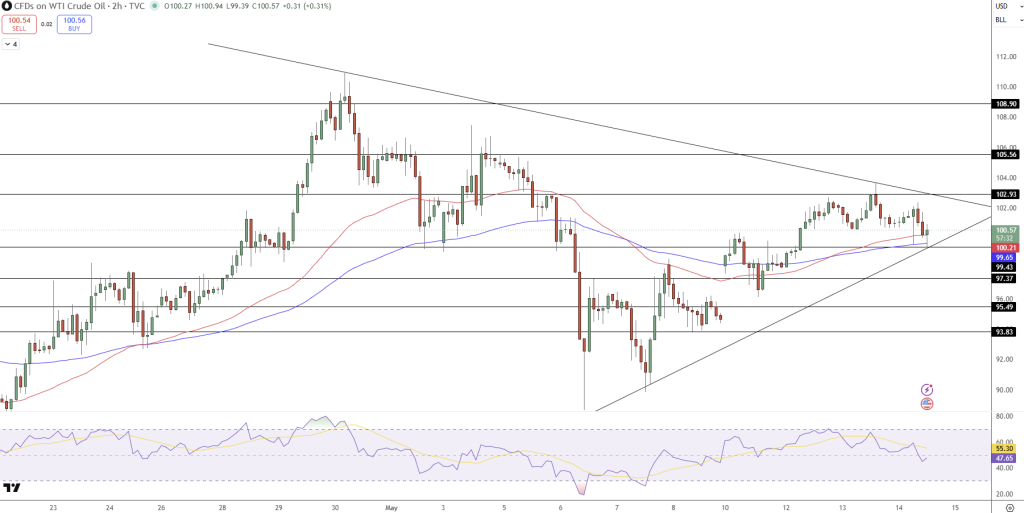
The chart looks pretty clean – with higher lows inside that rising channel and no breakdowns in sight – so it’s all looking pretty bullish at the moment. And that recent pull back did defend the 0.382–0.5 Fib retracement zone after that impulsve leg from $97.37, forming a bullish flag continuation pattern.
The RSI is pretty neutral at the moment, around 47–55, and there’s even a positive divergence on the dip – which is telling us that all that bearish pressure is starting to fade and there’s more room for oil prices to keep going before they get too overbought.
Key Levels
- Resistance: $102.86 → $104.59 → $106.56
- Support: $99.43 → $97.37
Trade Idea: Buy above $101.00 with a target of $102.86–$104.59 and a stop loss below $99.43. The focus is slowly starting to shift back to fundamentals, but the deal is still on pretty shaky ground.
- Check out our free forex signals
- Follow the top economic events on FX Leaders economic calendar
- Trade better, discover more Forex Trading Strategies
- Open a FREE Trading Account
- Read our latest reviews on: Avatrade, Exness, HFM and XM
Related Articles

Sidebar rates
Related Posts
